32 shared mobility stats from 2023 you should know in 2024
February 6, 2024
min. read


The shared mobility industry has experienced significant growth and transformation in 2023, with various segments such as ride-sharing, vehicle rental, and micro-mobility witnessing substantial changes.
From the rise of ride-hailing services to the increasing popularity of shared vehicles, the industry's landscape is evolving rapidly. This article presents 32 key statistics from 2023 that provide valuable insights into the current state and future prospects of the shared mobility sector, offering a comprehensive overview for industry stakeholders and observers.
The global shared mobility market is expanding rapidly, projecting a substantial increase in revenues and ridership. By 2030, it is poised to double its share of urban transport journeys from 2023. Additionally, the number of individuals earning from shared mobility services is forecasted to rise notably.
In Europe, shared vehicle services demonstrate considerable growth, with an increase in multi-mobility users. At the same time, European cities are the strictest shared micromobility regulators, limiting the number of operators and implementing various rules.
Global
Europe & UK
Shared car ridership has increased significantly, with notable upward trends in Q3 2023. The global ride-hailing market is also projected to witness substantial growth, with increased user numbers and an uptick in popularity over taxis in the United States. In Europe, German cities, led by Berlin, continue to dominate in total shared car ridership.
Electric scooter (e-scooter) ridership has declined, although it remains the predominant shared mobility choice, constituting 42% of total ridership. Moped ridership in Europe has similarly decreased, influenced by exits of key market players.
E-scooters have emerged as an environmentally friendly alternative, with 10% of rides directly replacing car journeys. Citizen referendums in Paris and evolving regulations in Amsterdam reflect the dynamic landscape of the electric scooter and moped market.
The global bike-sharing market shows significant growth. In Europe, station-based bikes have increased in popularity. Dockless bikes experienced an impressive surge as well, following the 2023 scooter ban in Paris. Overall, bike fleets and ridership are expanding across major European cities, contributing to a robust Trips/Vehicle/Day (TVD) ratio.
The shared mobility market continues to expand. With ride-sharing and micro-mobility playing pivotal roles, the future of shared mobility appears promising. The insights gathered from these statistics are crucial for understanding the shared mobility market's trajectory and its implications for the broader transportation ecosystem.
Let's make 2024 a year of shared mobility!
📆🚗 Managing vehicle availability is now easier than ever. Each rental vehicle can now have its own availability schedule, allowing operators or vehicle owners to define exactly when it can be booked. Keep vehicles available 24/7, create recurring weekly schedules, configure multiple unavailable periods, and make one-time availability changes directly from the calendar - all while preventing conflicts with existing bookings.
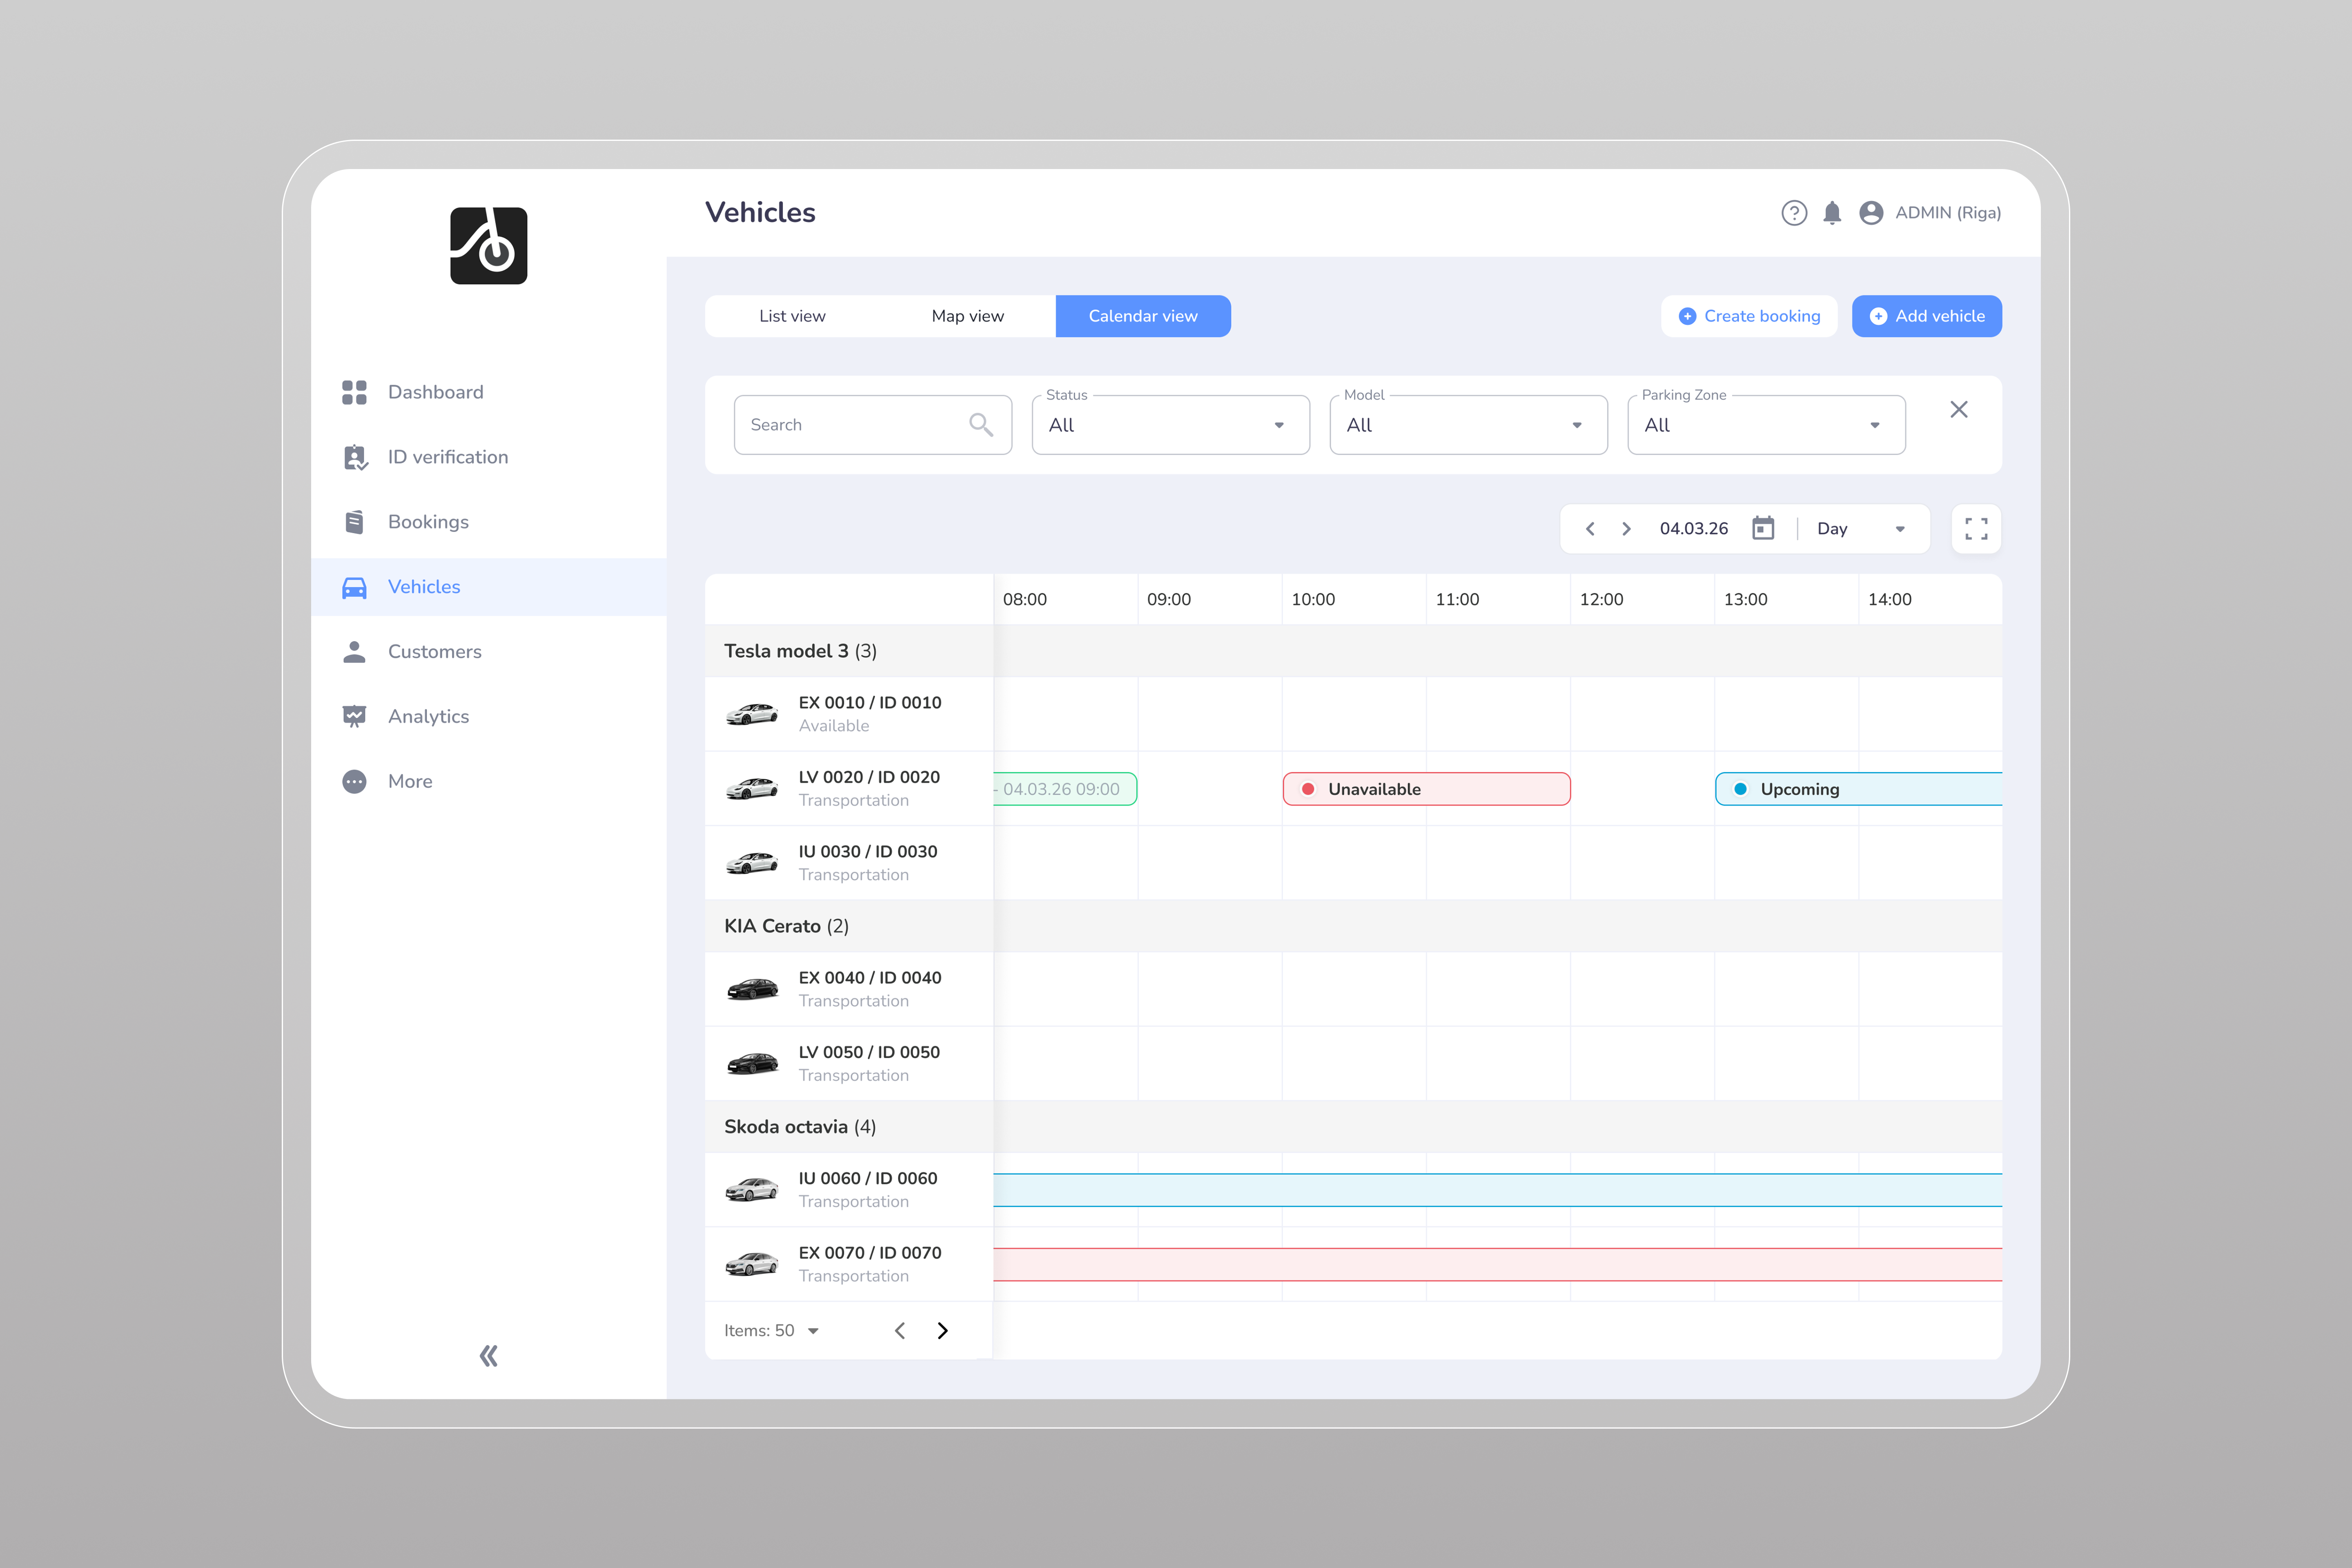
Managing vehicle availability has become much more flexible. With the new Vehicle availability calendar, every rental vehicle now has its own availability schedule, allowing operators or vehicle owners to define exactly when a vehicle can be booked.
By default, vehicles remain available 24/7, but operators can switch to a custom schedule and configure recurring unavailable periods or make one-time availability adjustments directly from the calendar.
📅 24/7 availability by default
Newly added vehicles are automatically available around the clock. No additional setup is required.
🔄 Recurring weekly availability schedules
Configure custom weekly availability for each individual vehicle by defining one or multiple unavailable periods for every day of the week.
Navigation:
Vehicles → Select vehicle → Edit → Set availability
⚙️ Multiple unavailable periods per day
Need to block vehicles for maintenance, charging, cleaning, or personal use? Add as many unavailable time slots as needed for each day.
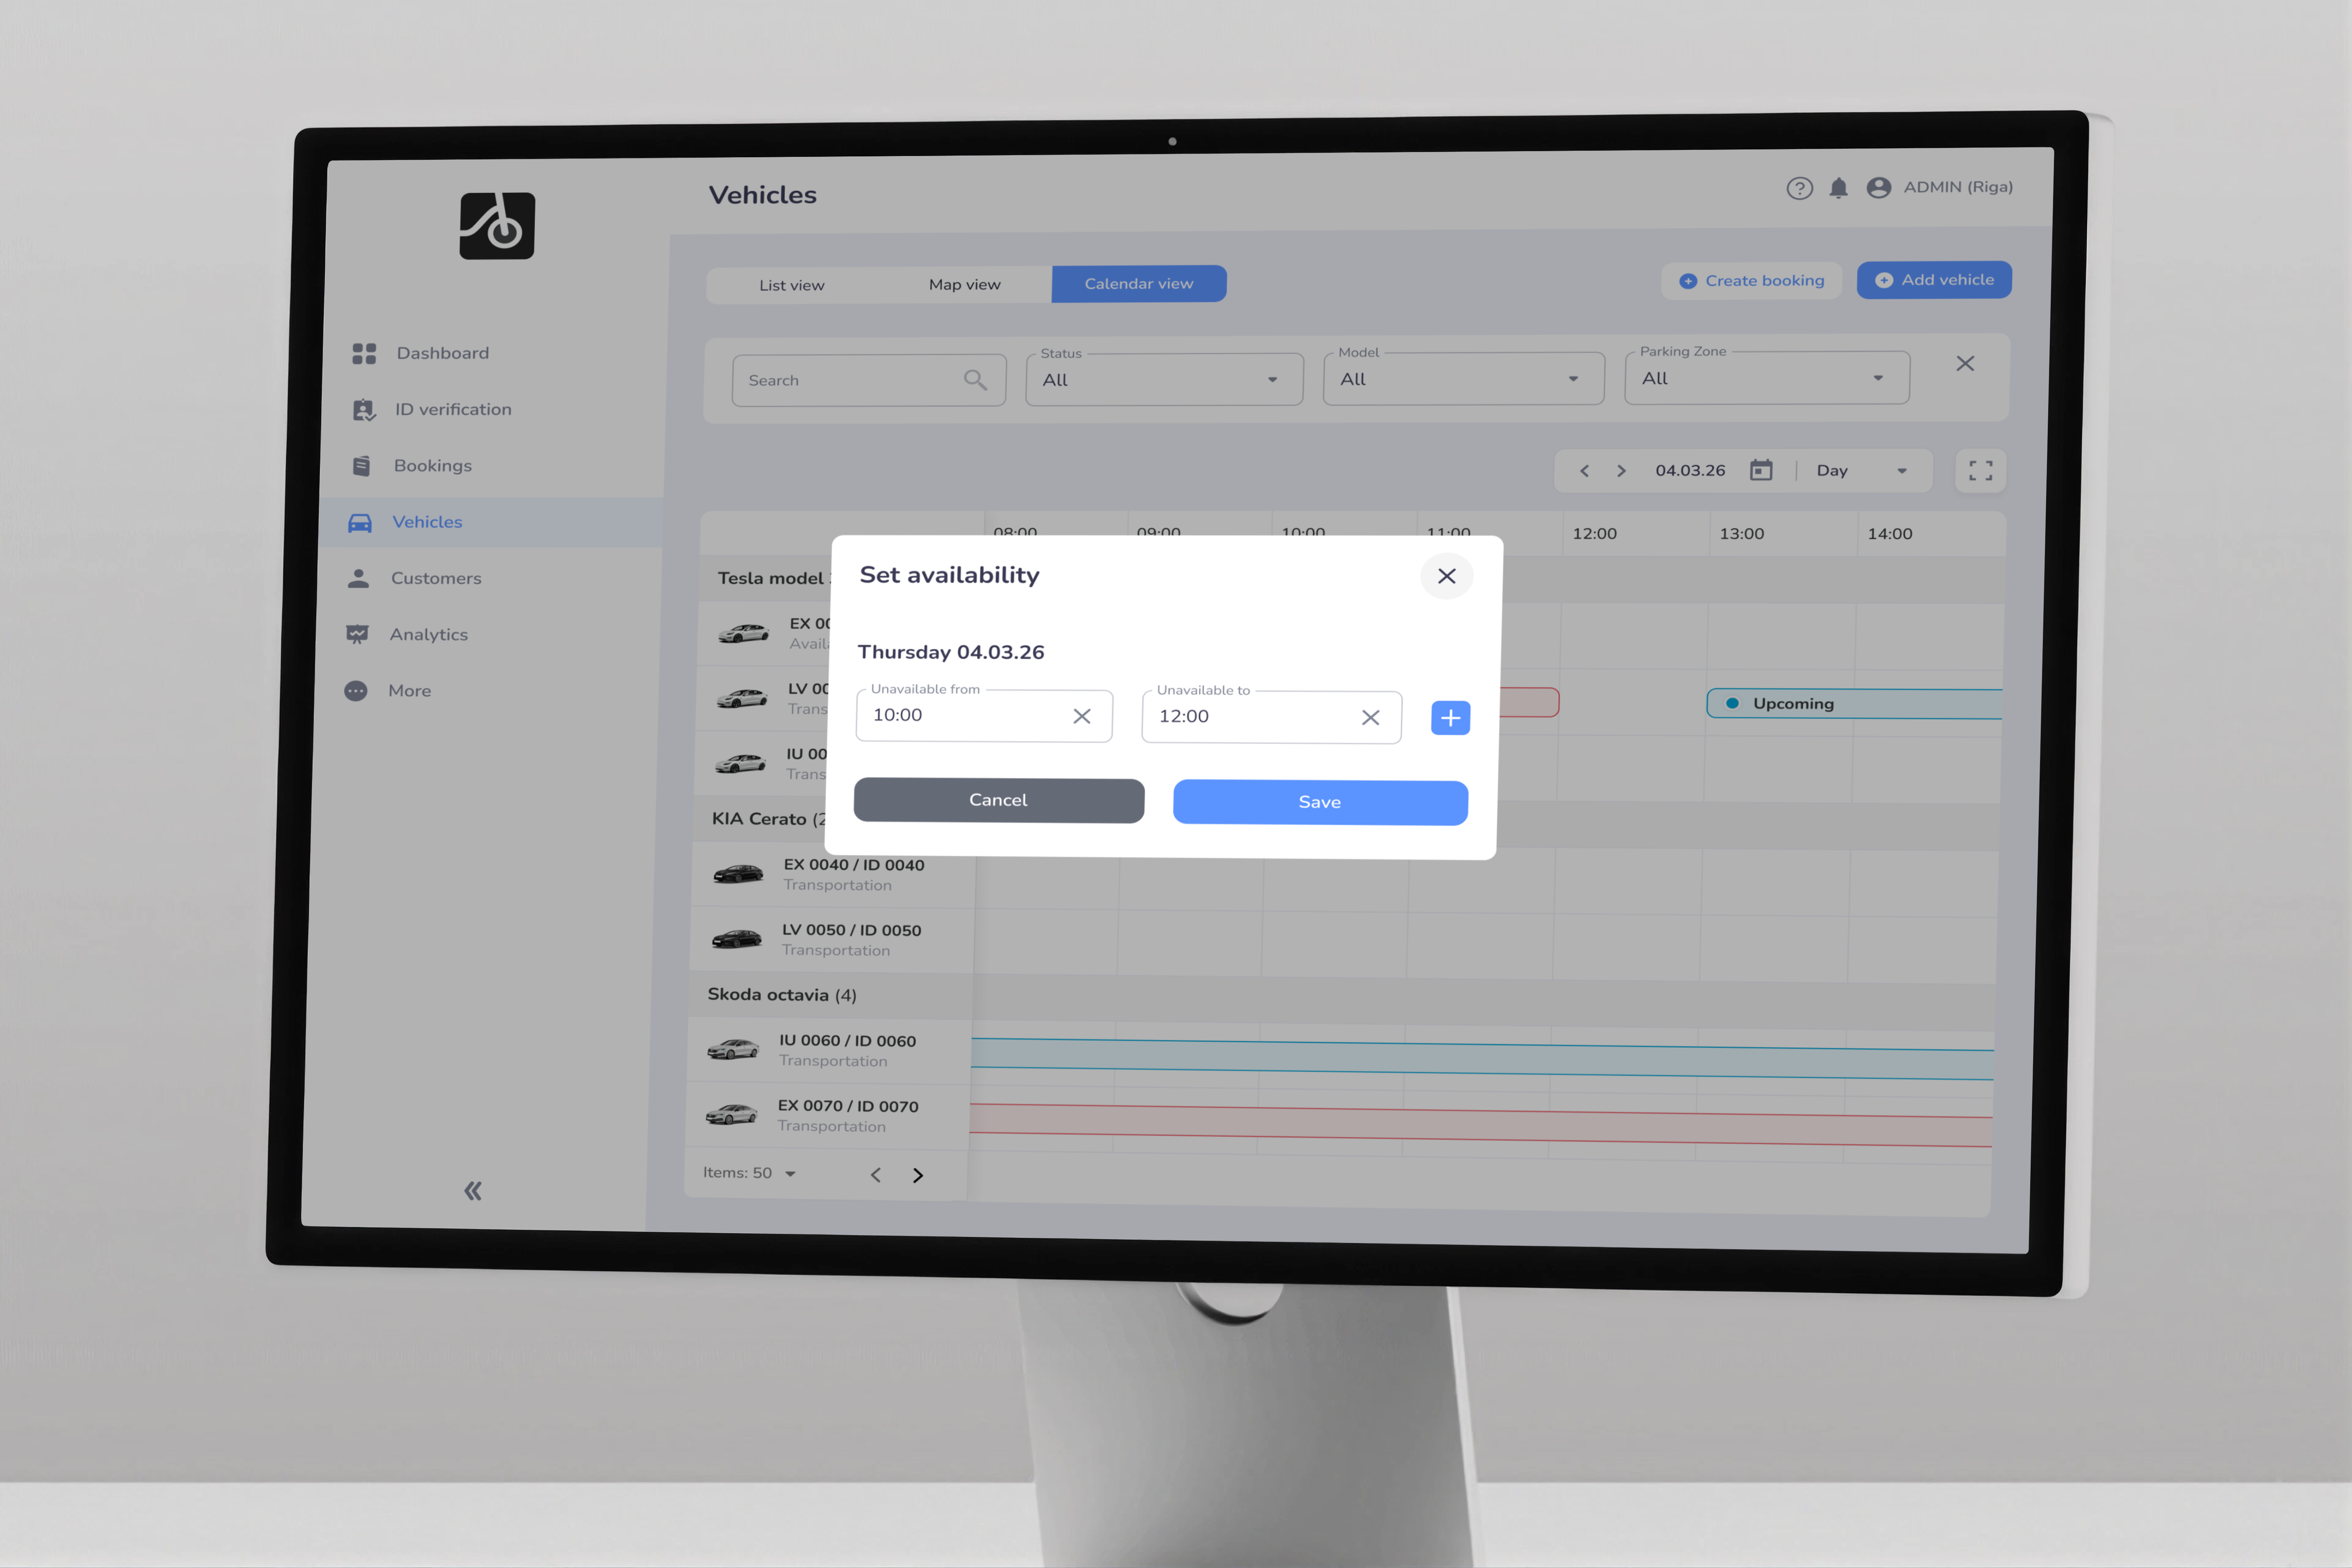
📆 One-time availability changes
Override the recurring schedule for a specific date without affecting the permanent weekly configuration. Perfect for holidays, temporary maintenance, or special events.
Navigation:
Vehicles → Calendar view → Click any available or unavailable time slot to add or edit
🔴 Visual availability overview
Unavailable periods are highlighted directly in the vehicle calendar, making it easy to identify when a vehicle can or cannot be booked.
🛡️ Booking conflict protection
To prevent scheduling issues, the system validates every availability change. If the selected period overlaps with an existing booking, the update cannot be saved and the operator will receive an error informing them that a booking already exists for that time.
The feature combines two layers of availability:
For example, if a vehicle is normally unavailable every Wednesday from 10:00–12:00, you can temporarily extend, edit or reduce availability for a single Wednesday while leaving all future Wednesdays unchanged.
P2P rental businesses often manage vehicles with different owner preferences and operating hours. This feature gives operators the flexibility to support virtually any availability scenario while keeping bookings accurate and preventing scheduling conflicts.
Whether you're managing a small peer-to-peer fleet or thousands of rental vehicles, the new vehicle availability calendar makes availability management significantly easier and more reliable.
📲 Choosing mobility software is a decision that can shape your business. 🔍 This review takes a deeper look at ATOM Mobility, covering how the platform works, 💰 its pricing model, 🔌 hardware flexibility, 🤝 customer support, and 🚀 the types of operators it's built for.
Choosing mobility software is a long-term decision. Once a platform is integrated into daily operations, replacing it can take months and require significant time and resources. That's why it's worth looking beyond feature lists and understanding how a platform performs in practice.
ATOM Mobility has become the leading white-label mobility platform for operators launching and scaling vehicle-sharing, car rental, and ride-hailing businesses. This review covers how the platform works, how its pricing is structured, what customers say about it, and the types of businesses it's best suited for.
ATOM Mobility is a white-label SaaS platform built specifically for mobility businesses.
Instead of developing software in-house, operators can launch their own branded mobility service using an established platform that already includes the infrastructure needed to run daily operations.
The platform brings together three products:
All three run on the same technology, allowing operators to manage multiple mobility services without maintaining separate software platforms.
ATOM Mobility uses a transparent pricing model based on a one-time implementation fee followed by a subscription that scales with the business. The exact cost depends on the products, integrations, and level of customization required, but customers know what is included from the start, without unexpected licensing costs or hidden platform fees.
Compared to building proprietary software or purchasing enterprise mobility platforms, ATOM Mobility can be up to five times more affordable, depending on the project and deployment requirements.
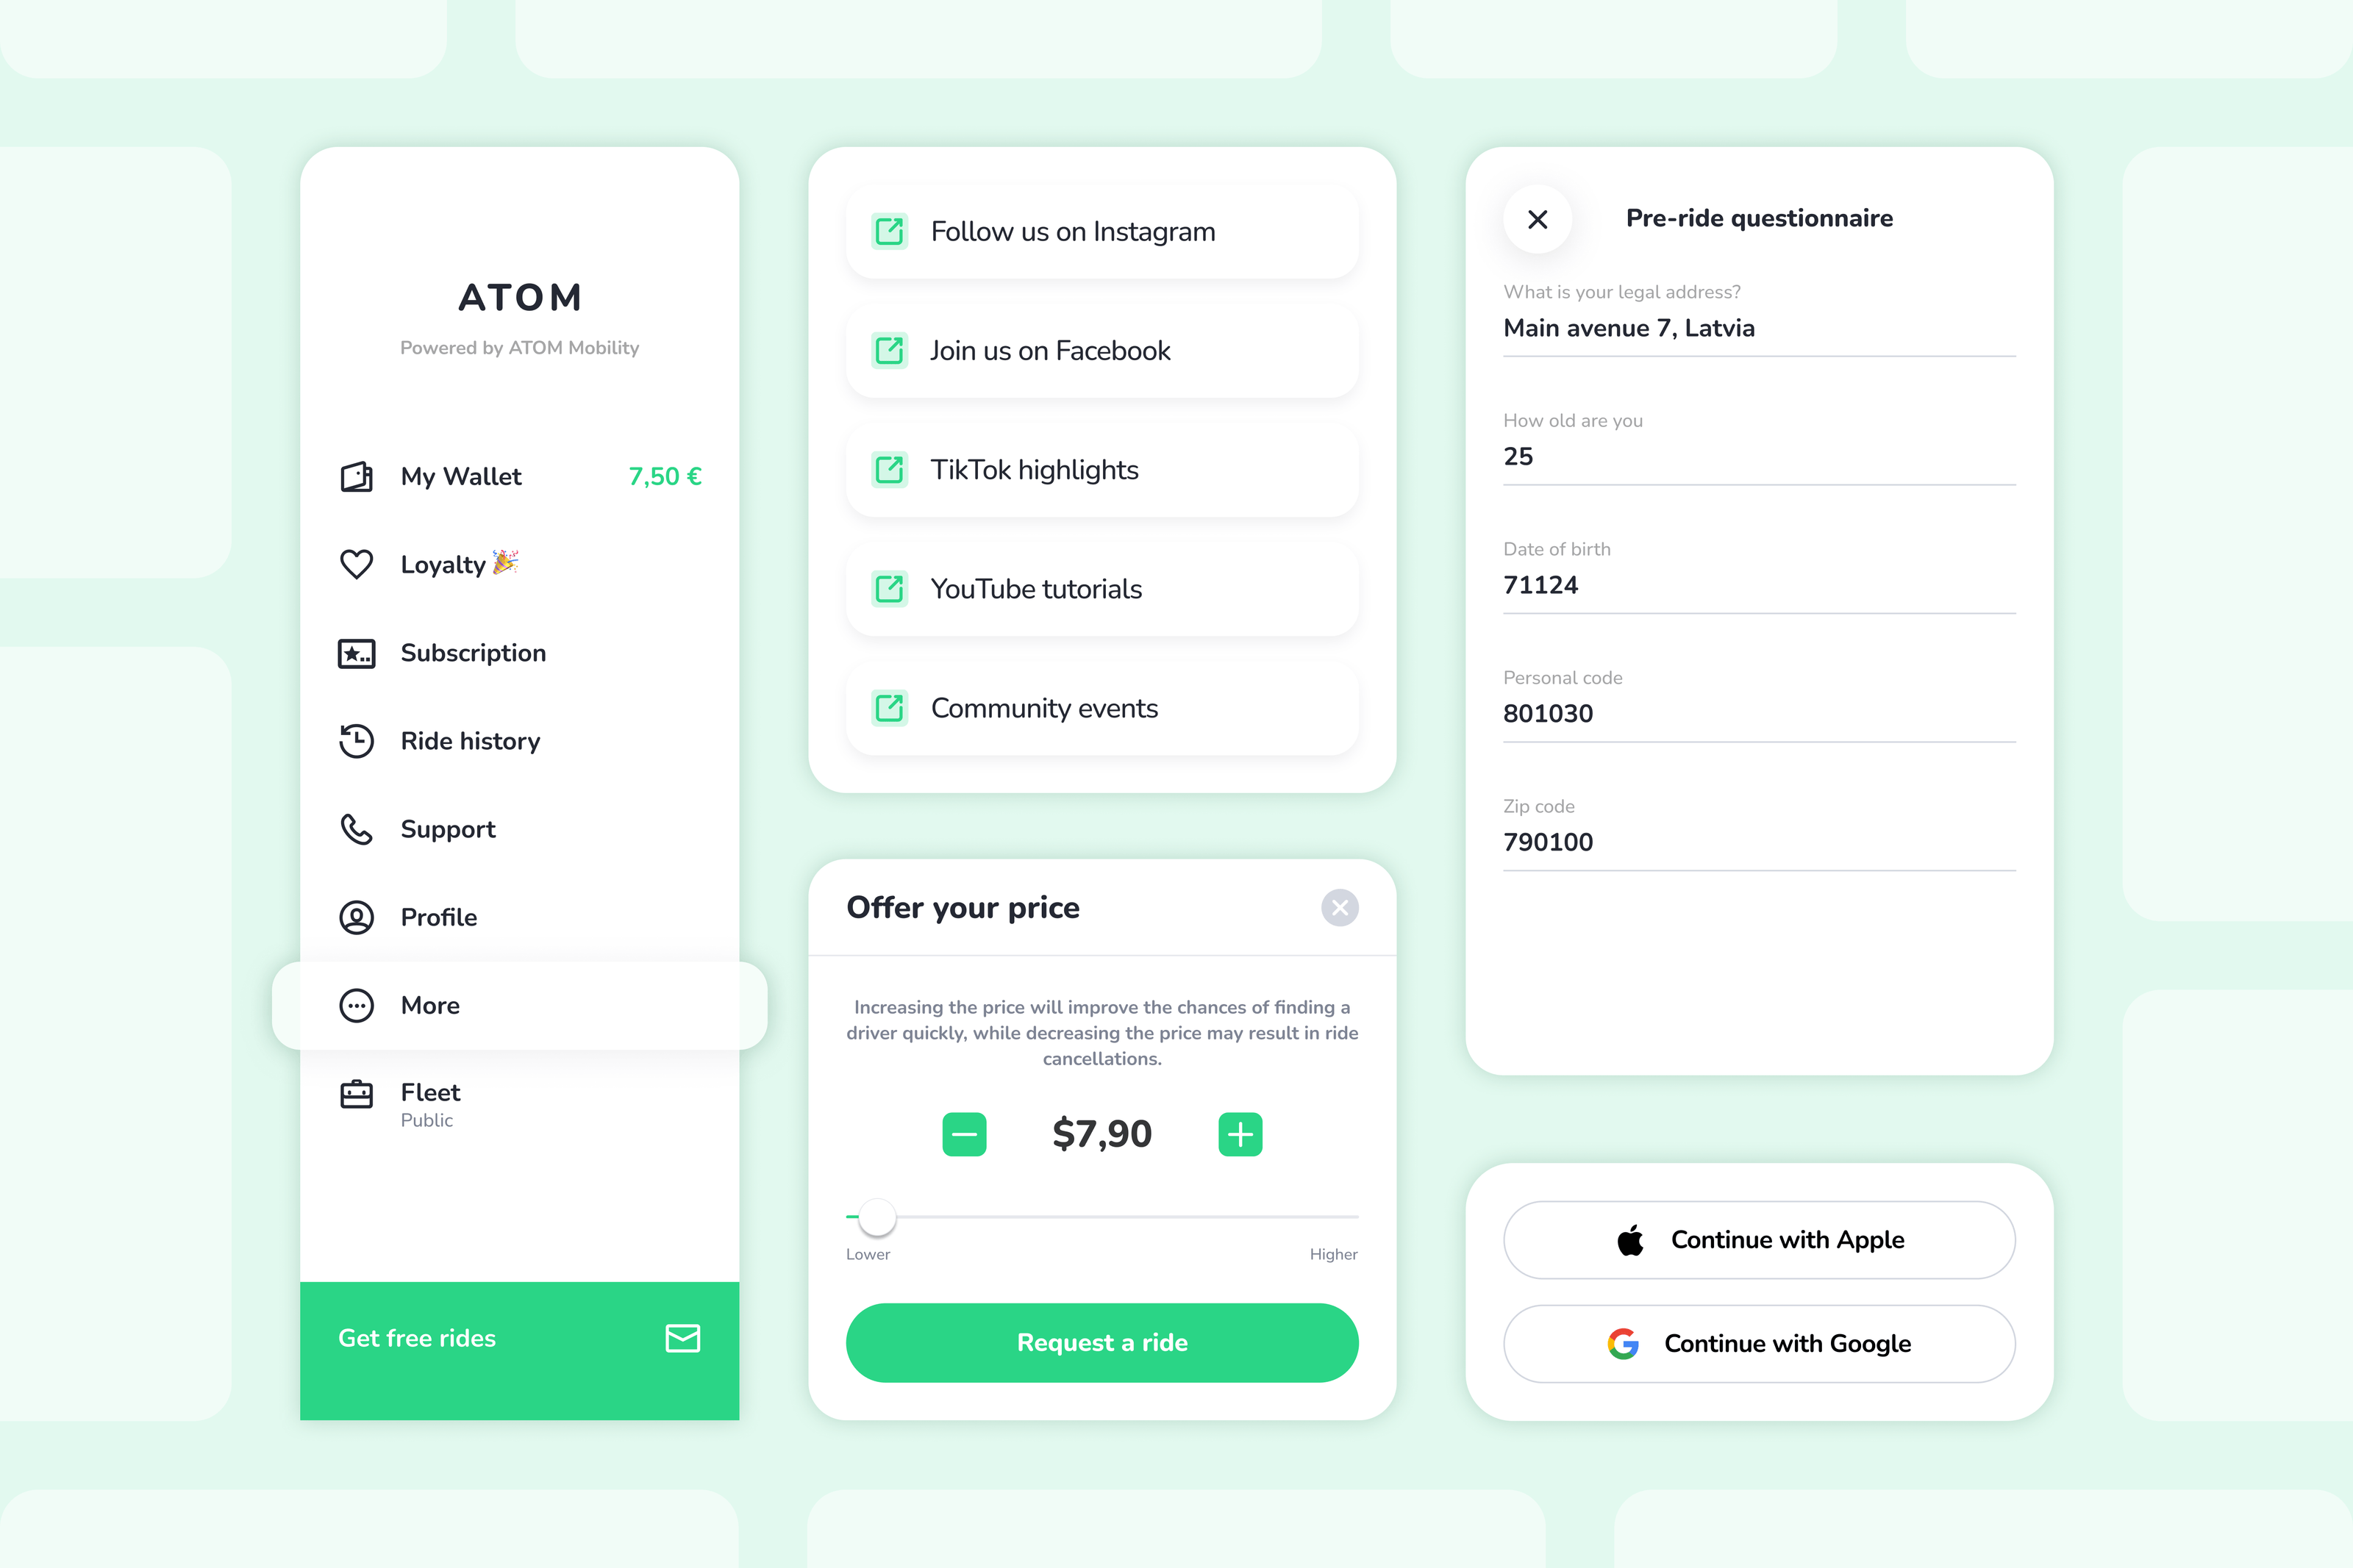
The rider app is an important part but not the only service on the platform. Customers use the mobile app to register, verify their identity, locate nearby vehicles, unlock them, make payments, purchase subscriptions, and manage bookings.
Operators manage the business through a web dashboard that provides access to fleet monitoring, pricing, reservations, customer management, payments, analytics, maintenance workflows, reporting, promotions, and day-to-day operations.
For fleet management, ATOM Mobility also offers a dedicated Operator app, designed to help teams manage vehicles, tasks, damages, and routes while on the go.
Companies offering ride-hailing services also receive a dedicated driver app, allowing drivers to accept rides, navigate trips, and track their earnings within the same ecosystem.
Altogether, the platform includes more than 300 features and 100+ integrations designed specifically for mobility operators, allowing businesses to launch 8-15 times faster than building comparable software from scratch.
One of ATOM Mobility's biggest advantages is its hardware flexibility. The platform works with numerous IoT providers and vehicle manufacturers, meaning operators are not locked into a single hardware supplier.
For example, if a business decides to replace its smart locks or expand its fleet with vehicles from another manufacturer, it doesn't need to replace the software platform as well. This gives operators more flexibility as their business evolves and reduces the risk of becoming dependent on a single hardware vendor. To name just a few, ATOM Mobility already supports integrations with Segway, Teltonika, Acton, Omni, Okai, Fitrider, Freego, Zimo, Marti, Comodule, Hongji, Yadea, NIU, NEXT, Geotab, Acacus, INVERS, Velco, Navee, Vaimoo, Dynasys, 2hire, Sentinel, Linka, and many others.
Launching a mobility business often requires close collaboration between the operator and the software provider, particularly during implementation and expansion.
ATOM Mobility provides support through email, WhatsApp, and scheduled calls with a dedicated team that has worked together for several years. Rather than speaking with a different representative every time, customers build relationships with specialists who become familiar with their business and operational goals. For urgent or business-critical matters, customers can also communicate directly with company leadership, including the CEO when needed.
ATOM Mobility has received consistently positive reviews on Capterra, where customers frequently highlight both the quality of the platform and the team behind it.
Some of the reviews describe ATOM Mobility as:
"ATOM is an exceptional app developer."
"Clear communication and good service."
"Atom has been a reliable partner to us for 3 seasons now."
"Great Partnership with the ATOM Team."
"Reliable Partner with Great Support and Continuous Improvements."
Across the reviews, the same themes appear repeatedly: responsive communication, long-term partnerships, and continuous product development.
ATOM Mobility is designed for companies that want to launch, operate, or scale a mobility business without spending years developing proprietary software. The platform is ideal for entrepreneurs launching their first mobility service, SMEs entering the shared mobility market, established operators expanding into new cities or mobility verticals, and fleet operators managing anywhere from a single vehicle to more than 10,000 vehicles who need a modern, feature-rich platform at a reasonable cost.
Because the platform is white-label, operators keep full control over their branding, pricing strategy, and customer experience while relying on technology that has already been proven across more than 80 different markets.
ATOM Mobility is built specifically for vehicle sharing, car rental, and ride-hailing businesses. Companies such as Uber, Bolt, Lime, and Voi have invested hundreds of millions of dollars and many years into developing proprietary software, creating platforms that are deeply integrated into their operations. While replacing such systems could potentially deliver commercial benefits, the migration effort, operational risk, and loss of flexibility that comes with owning and customizing their own technology make a complete platform switch unlikely. As a result, these companies typically continue investing in their in-house platforms rather than adopting third-party software.
Similarly, companies looking to build software outside the mobility sector or develop entirely different types of platforms may find that ATOM Mobility's feature set is too focused on its core products.
Like any software platform, ATOM Mobility has strengths as well as situations where another approach may be a better fit.
Pros
Potential limitations
For startups, SMEs, and growing mobility operators, ATOM Mobility offers a practical alternative to building software in-house. The platform combines three mobility products in a single ecosystem, supports a wide range of hardware providers, and includes the operational tools needed to launch and scale a business. Beyond the technology itself, customers gain access to ATOM Academy - industry expertise, best practices, and educational resources, helping them avoid common mistakes and build a successful mobility business faster.
It isn't intended to replace proprietary platforms developed by companies such as Uber or Bolt, nor is it designed for businesses outside the mobility sector. For operators looking for an established white-label platform backed by long-term customer support and continuous product development, ATOM Mobility is a solution worth considering.
Driver App demo credentials - Email: test@atom.com, Password: driver

