Is car sharing profitable in 2025?
July 23, 2025
min. read

In 2024, the global car-sharing market was valued at approximately €8.9 billion, with Europe accounting for over 50.2% of that total. Analysts forecast it will grow at a CAGR of 11.8% between 2025 and 2033, reaching roughly €24.4 billion by 2033. This blend of urbanization, environmental regulation and a growing preference for flexible mobility continues to create fertile ground for operators - yet not every service finds a clear path to profitability.
Success hinges on your location, business model, fleet, operations and local market dynamics. There are strong success stories, but also many high-profile failures. Here’s a closer look at what really affects profitability in today’s car-sharing market - and what you can learn from real-world cases.
Profitability in car sharing boils down to securing enough paid usage while keeping costs under control. Every unused hour or unnecessary expense erodes margins.
Key factors:
The operators who win are those who combine solid daily usage with lean operations.
29 March 2025 marked the end of Panek’s car-sharing experiment. Despite peaking at 2 700–3 000 vehicles, Panek never turned a profit in over seven years.
Faced with persistent losses, Panek’s leadership refocused on profitable core segments: daily/weekly rentals, corporate leasing and Fleet-as-a-Service.
WiBLE (50/50 joint venture between Kia Europe and Repsol) launched in 2018 and has just closed its second consecutive year with positive EBITDA.
Key enablers:
After five years of absorbing fixed-cost drag and depreciation, WiBLE now leverages Madrid’s regulatory environment (low-emission zones, parking benefits) and delivers lean, tech-driven operations.
SOCAR (backed by SoftBank, SK Inc. and Lotte Group) operates 20 000 vehicles, generates nearly €300 million in annual turnover and has 20% of South Koreans signed up.
By pairing massive scale with savvy car lifecycle management, extra-long rental duration, SOCAR converts high utilization into robust profitability.
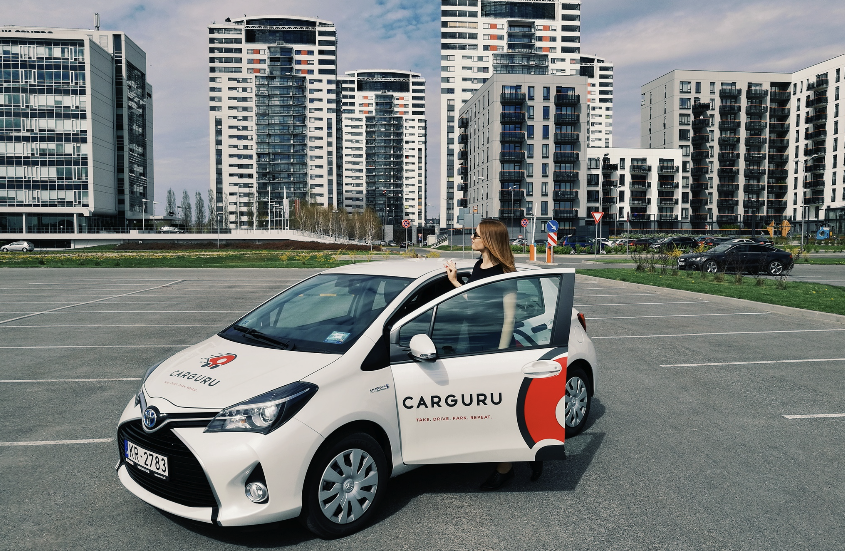
30 August 2024: Carguru (est. 2017) acquired EV-focused OX Drive (est. 2021), adding 200+ Tesla to the fleet.
Outcome: A combined ICE, hybrid and EV fleet—backed by local expertise and strategic acquisitions - has driven strong growth and high utilization.
With clear benchmarks and smart execution - drawing on lessons from Panek, WiBLE, SOCAR and Carguru - car sharing can still be a highly profitable component of a modern mobility portfolio.
If you’re planning to start or improve your service, ATOM Mobility is ready to help. We’ve built the platform and supported dozens of teams worldwide - reach out, and we’ll share what we’ve learned.
Image credit: https://kursors.lv/2018/03/13/carguru-palielina-autoparku-un-paplasina-darbibas-zonas-mikrorajonos
🚲 🛴 E-scooters or e-bikes? Docked or dockless? Every vehicle choice shapes the success of your micromobility business. In this new article, we break down the key micromobility fleet vehicles – their features, best use cases, and how to match them to your city profile. Plus, how ATOM Mobility helps operators manage both scooter and bike fleets in one platform.
Operators entering the micromobility space today face one major early decision: which vehicles to deploy. Your fleet type affects user experience, operational costs, maintenance needs, and regulatory compliance. Whether you plan to launch e‑scooters, e‑bikes, mopeds, or a mixed fleet, each vehicle category serves a different purpose.
This guide covers the main micromobility fleet vehicles – bike, e‑bike, kick scooter, e‑scooter, moped, and e‑moped – along with their features, common manufacturers, docking options, and ideal use cases.
Understanding the vehicle types
Bike (mechanical bicycle) A standard pedal bicycle with no motor. In shared fleets, mechanical bikes are simple, durable, and cost‑efficient. They require minimal electronics and are ideal for cities with strong cycling infrastructure. They generate lower maintenance costs but depend entirely on rider effort. Normally, user demand for this type of bike is also lower, thus operators can expect lower RPV rate (rides per vehicle per day).
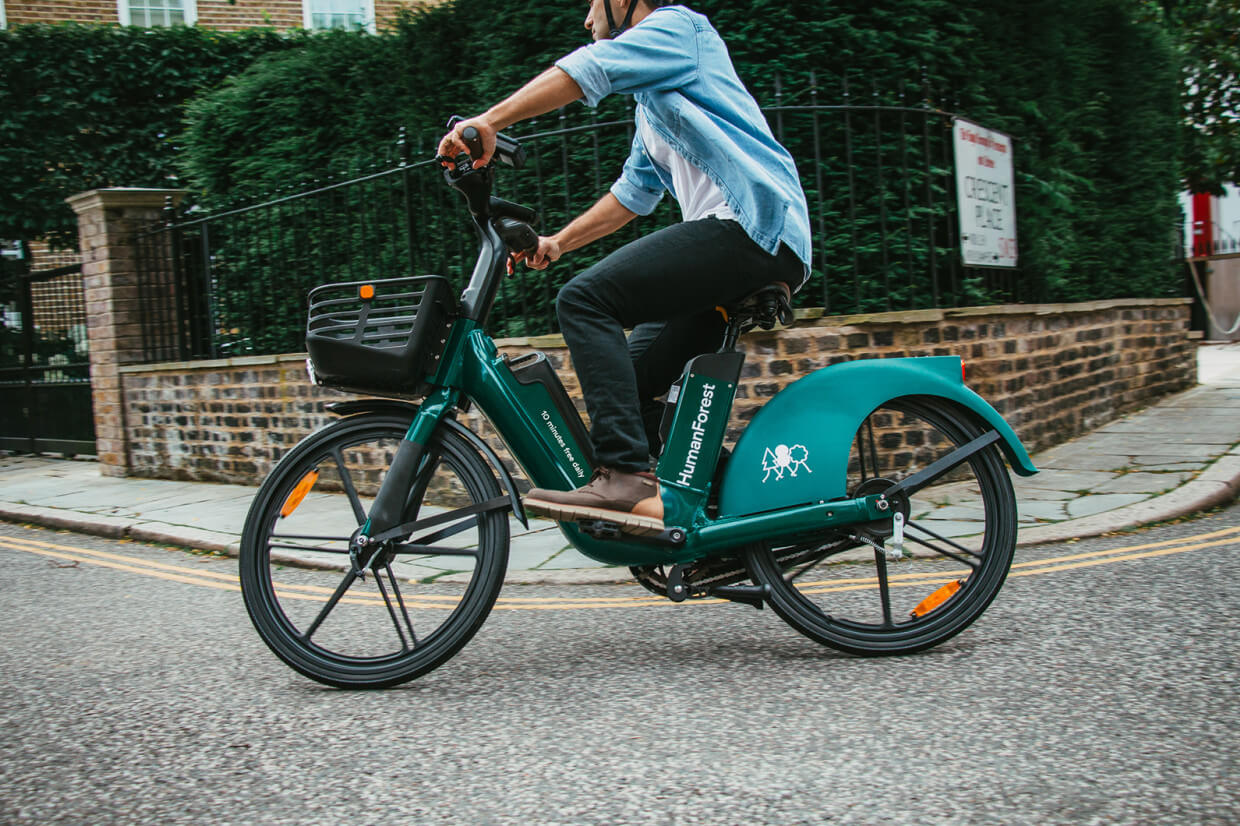
E‑bike (electric bicycle) An electric bike combines pedal power with an electric motor that assists the rider. E‑bikes allow longer trips, easier hill climbing, and broader user appeal. Typical shared e‑bike trips range between 5–10 km. They cost more upfront but often generate higher revenue per ride. Many fleet operators source models from manufacturers such as Segway‑Ninebot, Okai, and Yadea. You can explore available e‑bike hardware options on the ATOM Mobility vehicles page: https://www.atommobility.com/vehicles.
Kick scooter (non‑electric scooter) A kick scooter is manually powered by pushing off the ground. While less common in commercial shared fleets today, they are still used in some controlled campus or tourism environments where low speed and low complexity are priorities.
E‑scooter (electric scooter) E‑scooters are lightweight, battery‑powered vehicles designed for short urban trips, typically under 4 km. They are highly flexible and well suited for dense city centers and first‑mile/last‑mile transport. Modern fleet models include swappable batteries, improved braking systems, suspension upgrades, and integrated IoT modules. Popular manufacturers include Segway‑Ninebot, Okai, and Navee that can also be found at ATOM Mobility.
Moped (fuel‑powered light motorcycle) A moped is a small motorized vehicle traditionally powered by gasoline, offering higher speeds and longer range than bikes or scooters. In shared mobility, fuel mopeds are becoming less common due to emissions regulations but still operate in some regions.
E‑moped (electric moped) An e‑moped is an electric version of a traditional moped. It provides longer range and higher speed than e‑scooters, often up to 45 km/h depending on local regulations. E‑mopeds are ideal for suburban areas or cities with longer commuting distances. Manufacturers such as NIU, Silence, Super Soco, and Yadea dominate this segment.
The table below provides a general comparison of the most common shared mobility vehicle types, including typical purchase prices, expected service life in commercial fleets, and average utilization (rides per vehicle per day). Actual figures vary depending on manufacturer, market, operating conditions, and fleet maintenance.
Approx. new purchase price – The typical cost of purchasing a new commercial-grade vehicle for a shared mobility fleet. Prices vary depending on the manufacturer, hardware specifications, battery capacity, IoT integration, and fleet order size.
Approx. used purchase price – The typical market price of a pre-owned commercial vehicle suitable for shared mobility operations. Factors such as vehicle age, mileage, battery health (for electric vehicles), overall condition, and refurbishment status significantly influence the price.
Typical fleet lifespan – The average period a vehicle remains economically viable in a shared mobility fleet before being retired or replaced. Lifespan depends on ride frequency, maintenance quality, weather conditions, road infrastructure, vandalism, accidents, and how intensively the fleet is operated.
Average rides/day/vehicle (RPV) – Rides Per Vehicle per Day (RPV) is one of the most important performance metrics for shared mobility operators. It measures the average number of completed trips each vehicle performs daily. Higher RPV generally leads to better fleet utilization, faster return on investment, and improved profitability. Actual RPV varies depending on vehicle type, city size, demand, seasonality, pricing strategy, fleet availability, and operational efficiency.
Docked vs dockless infrastructure
Beyond vehicle choice, parking strategy matters. Dockless fleets offer flexibility but may create parking compliance challenges. Docked systems use physical stations that improve order, security, and charging efficiency.
Several manufacturers specialize in docking and locking infrastructure, including KNOT CITY (which recently is out of market), and Kuhmute. These docking systems can improve vehicle organization, reduce vandalism, and simplify charging logistics for e‑bikes and e‑mopeds.
E‑scooters: Best for dense urban zones
E‑scooters work best in compact city centers, student districts, and areas with high short‑trip demand. They require less parking space and are faster to deploy. However, they demand consistent maintenance and battery management.
E‑bikes: Broader demographic appeal
E‑bikes provide greater comfort and stability, making them suitable for older users, tourists, and riders carrying bags. They perform well in cities with established cycling lanes or moderate hills. Although more expensive than scooters, they often achieve longer ride durations and stronger customer loyalty.
E‑mopeds: Extended range and higher revenue potential
E‑mopeds are suitable for cities with wider geography or suburban commuting patterns. They typically deliver higher revenue per trip but require licensing compliance and more robust fleet management.
Matching vehicles to city profiles
Tourist cities often benefit from e‑bikes due to comfort and sightseeing suitability. College towns frequently lean toward e‑scooters because of affordability and convenience. Larger or hilly cities may support mixed fleets. Suburban zones often justify e‑mopeds for longer travel distances.
Climate also influences hardware decisions. Wet or cold regions require sealed wiring, water‑resistant components, and tires suitable for slippery conditions.
Planning your hardware strategy
Choosing the right fleet is not only about vehicle type. It involves sourcing reliable manufacturers, evaluating docking options, understanding regulatory requirements, and planning maintenance cycles. Reviewing available hardware categories through ATOM Mobility’s vehicles directory can help operators compare models and integrations before committing to a large fleet purchase.
The most successful operators treat fleet composition as flexible. They start with one category and expand based on usage data, seasonality, and rider behavior. A balanced hardware strategy allows adaptation without replacing the entire fleet.
ATOM Mobility supports mixed fleets – including e‑scooters, e‑bikes, and e‑mopeds – within one platform, covering booking, payments, hardware integrations, and analytics. This allows operators to scale gradually while maintaining operational control.
Vehicle choice is not static. As cities evolve and regulations tighten, operators who understand their hardware options and adapt quickly are better positioned for long‑term growth.
🚕 Getting drivers on the road is not the only thing you need to launch your taxi business. Many new platforms struggle with the same problem – drivers with no demand and riders with no available drivers. Building both at the same time is where most launches fail. This article introduces the key steps to launch a taxi business and avoid the most common mistakes.
Launching a taxi business today takes more than having drivers. It requires a system that can attract riders, onboard drivers, manage bookings, process payments, and keep daily operations running smoothly as demand grows.
The ride-hailing market is growing fast, while customer acquisition is getting more expensive and more competitive. Technavio estimates the global ride-hailing market will grow by more than $102 billion between 2024 and 2029, which creates room for new operators, but also raises the cost of visibility, paid acquisition, and brand differentiation in crowded markets, according to this ride-hailing services market forecast.
Many operators now launch faster by using ready-made tools instead of building every part from scratch. ATOM Mobility has already helped operators launch mobility businesses in as little as 90 days through a phased rollout covering market validation, legal setup, branding, driver onboarding, and launch execution.
But how to actually launch your business, if you’re not willing to do everything from scratch?
Most taxi businesses do not fail because the app is missing a feature but because there is no clear reason for customers to switch. Before choosing software or recruiting drivers, define where your opportunity is. That could mean:
This matters more than most expect. Your pricing, branding, driver experience, and customer acquisition all depend on the niche you choose. That is why defining a clear angle early matters, especially in crowded markets.
A taxi business is still a regulated business. Before launch, you need to set up the basics properly:
Skipping this part slows everything down later.
This is also the stage where many founders underestimate operating costs. Beyond software, you will need to plan for driver incentives, support, payment processing, and customer acquisition. That is one reason many operators now launch with white-label software instead of funding a custom build from day one.
Building a taxi app from scratch is expensive (in many cases we see it costs more than 30 000 -50 000 EUR), slow (takes many monhts), and usually unnecessary. To launch a working taxi business, you need:
Most early-stage operators do not need to build these systems themselves but a working infrastructure they can brand and launch quickly. That is why many operators start with ATOM Mobility, where the full system already includes rider and driver apps, dispatch tools, payments, analytics, integrations and backend operations in one platform. This is the same logic behind building a branded taxi service with white-label software instead of spending months on custom development.
Driver onboarding needs to be fast and easy enough that drivers can register, upload documents, get approved, and start working without delays. But if onboarding takes too long, drivers drop off before they complete their first ride.
A strong launch setup should include:
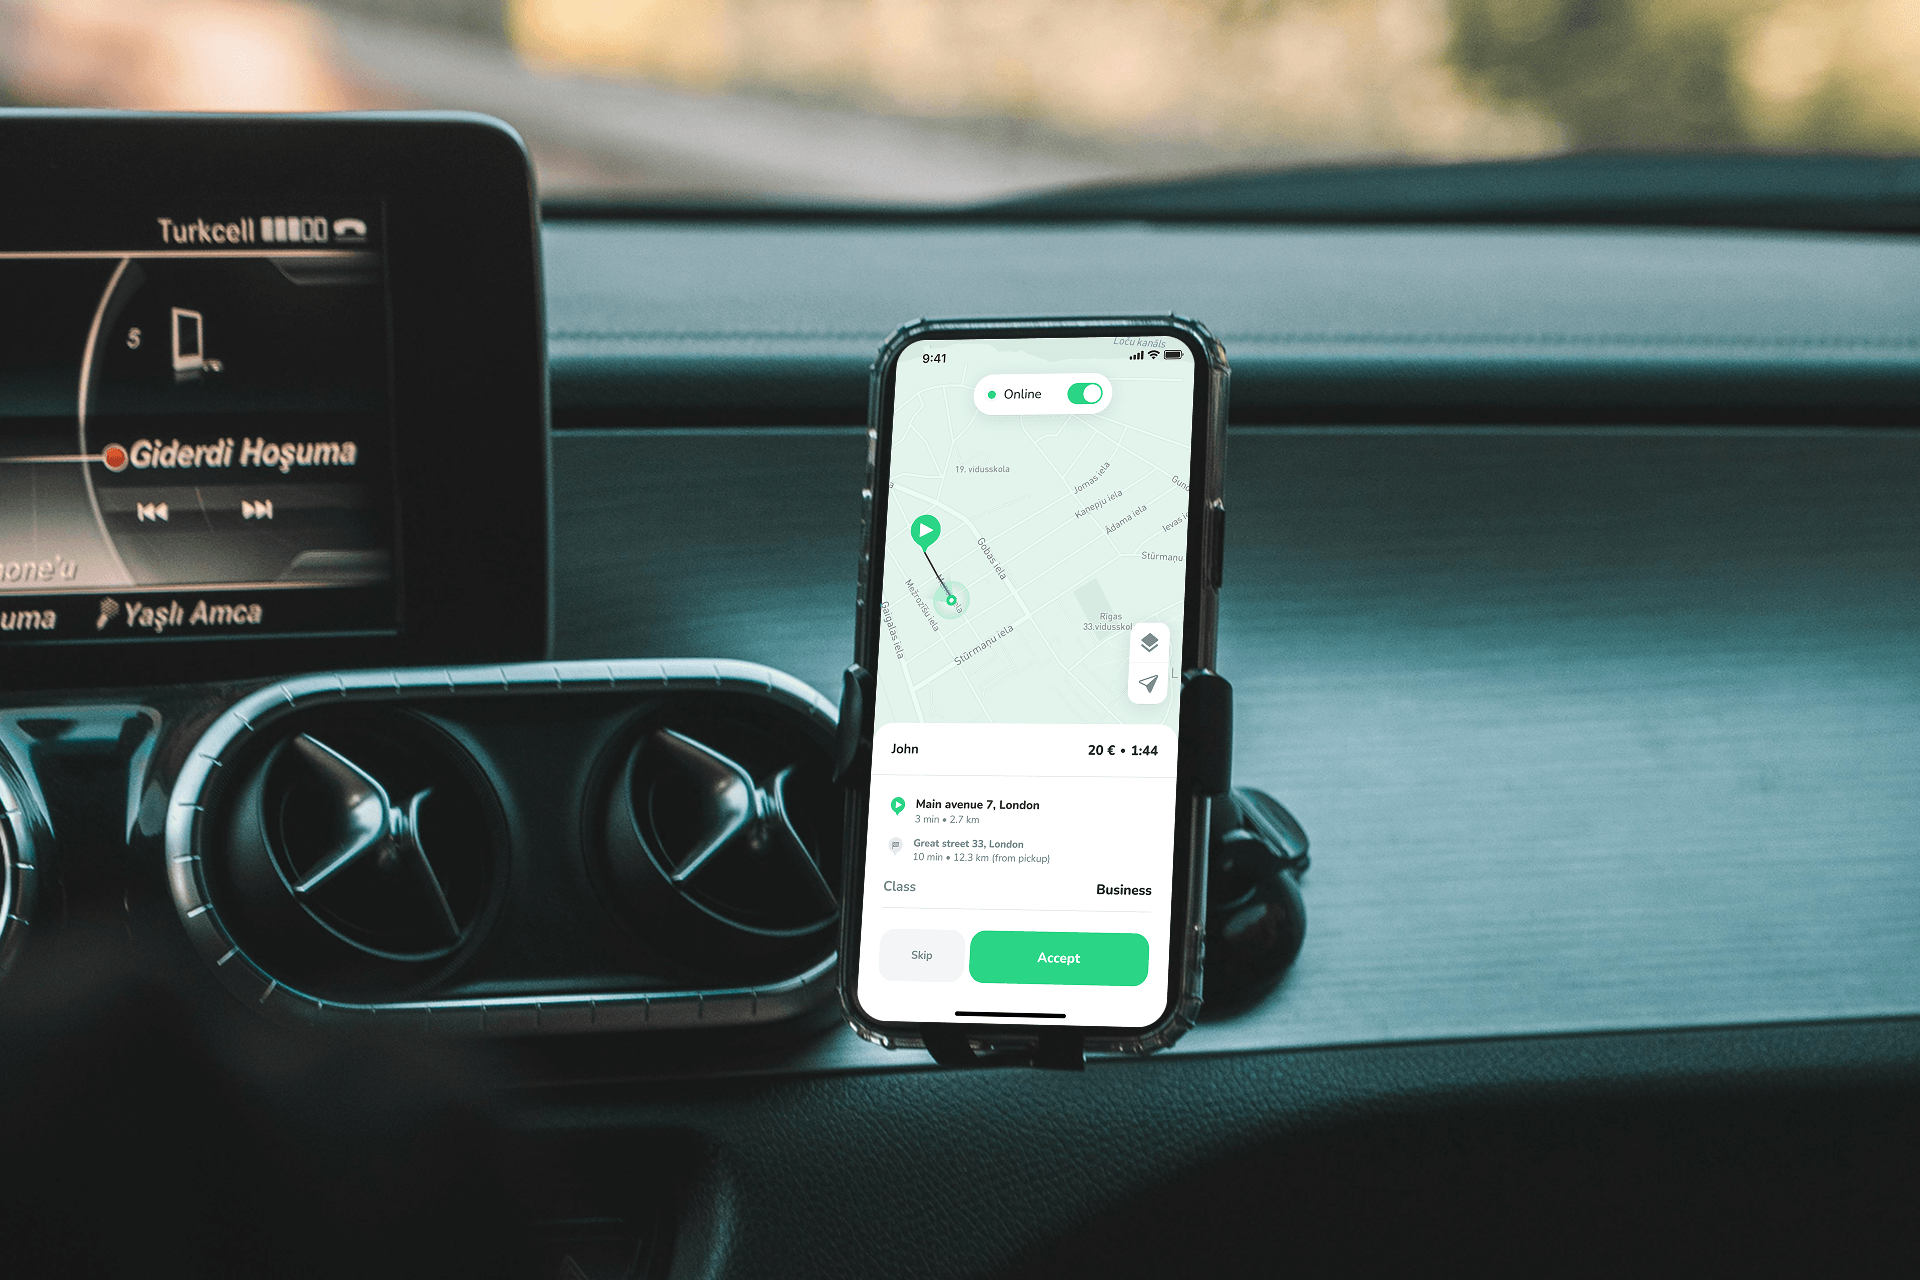
This is also where the ATOM Mobility driver app becomes important, since it gives drivers one place to accept rides, navigate, manage earnings, and stay active without switching between tools.
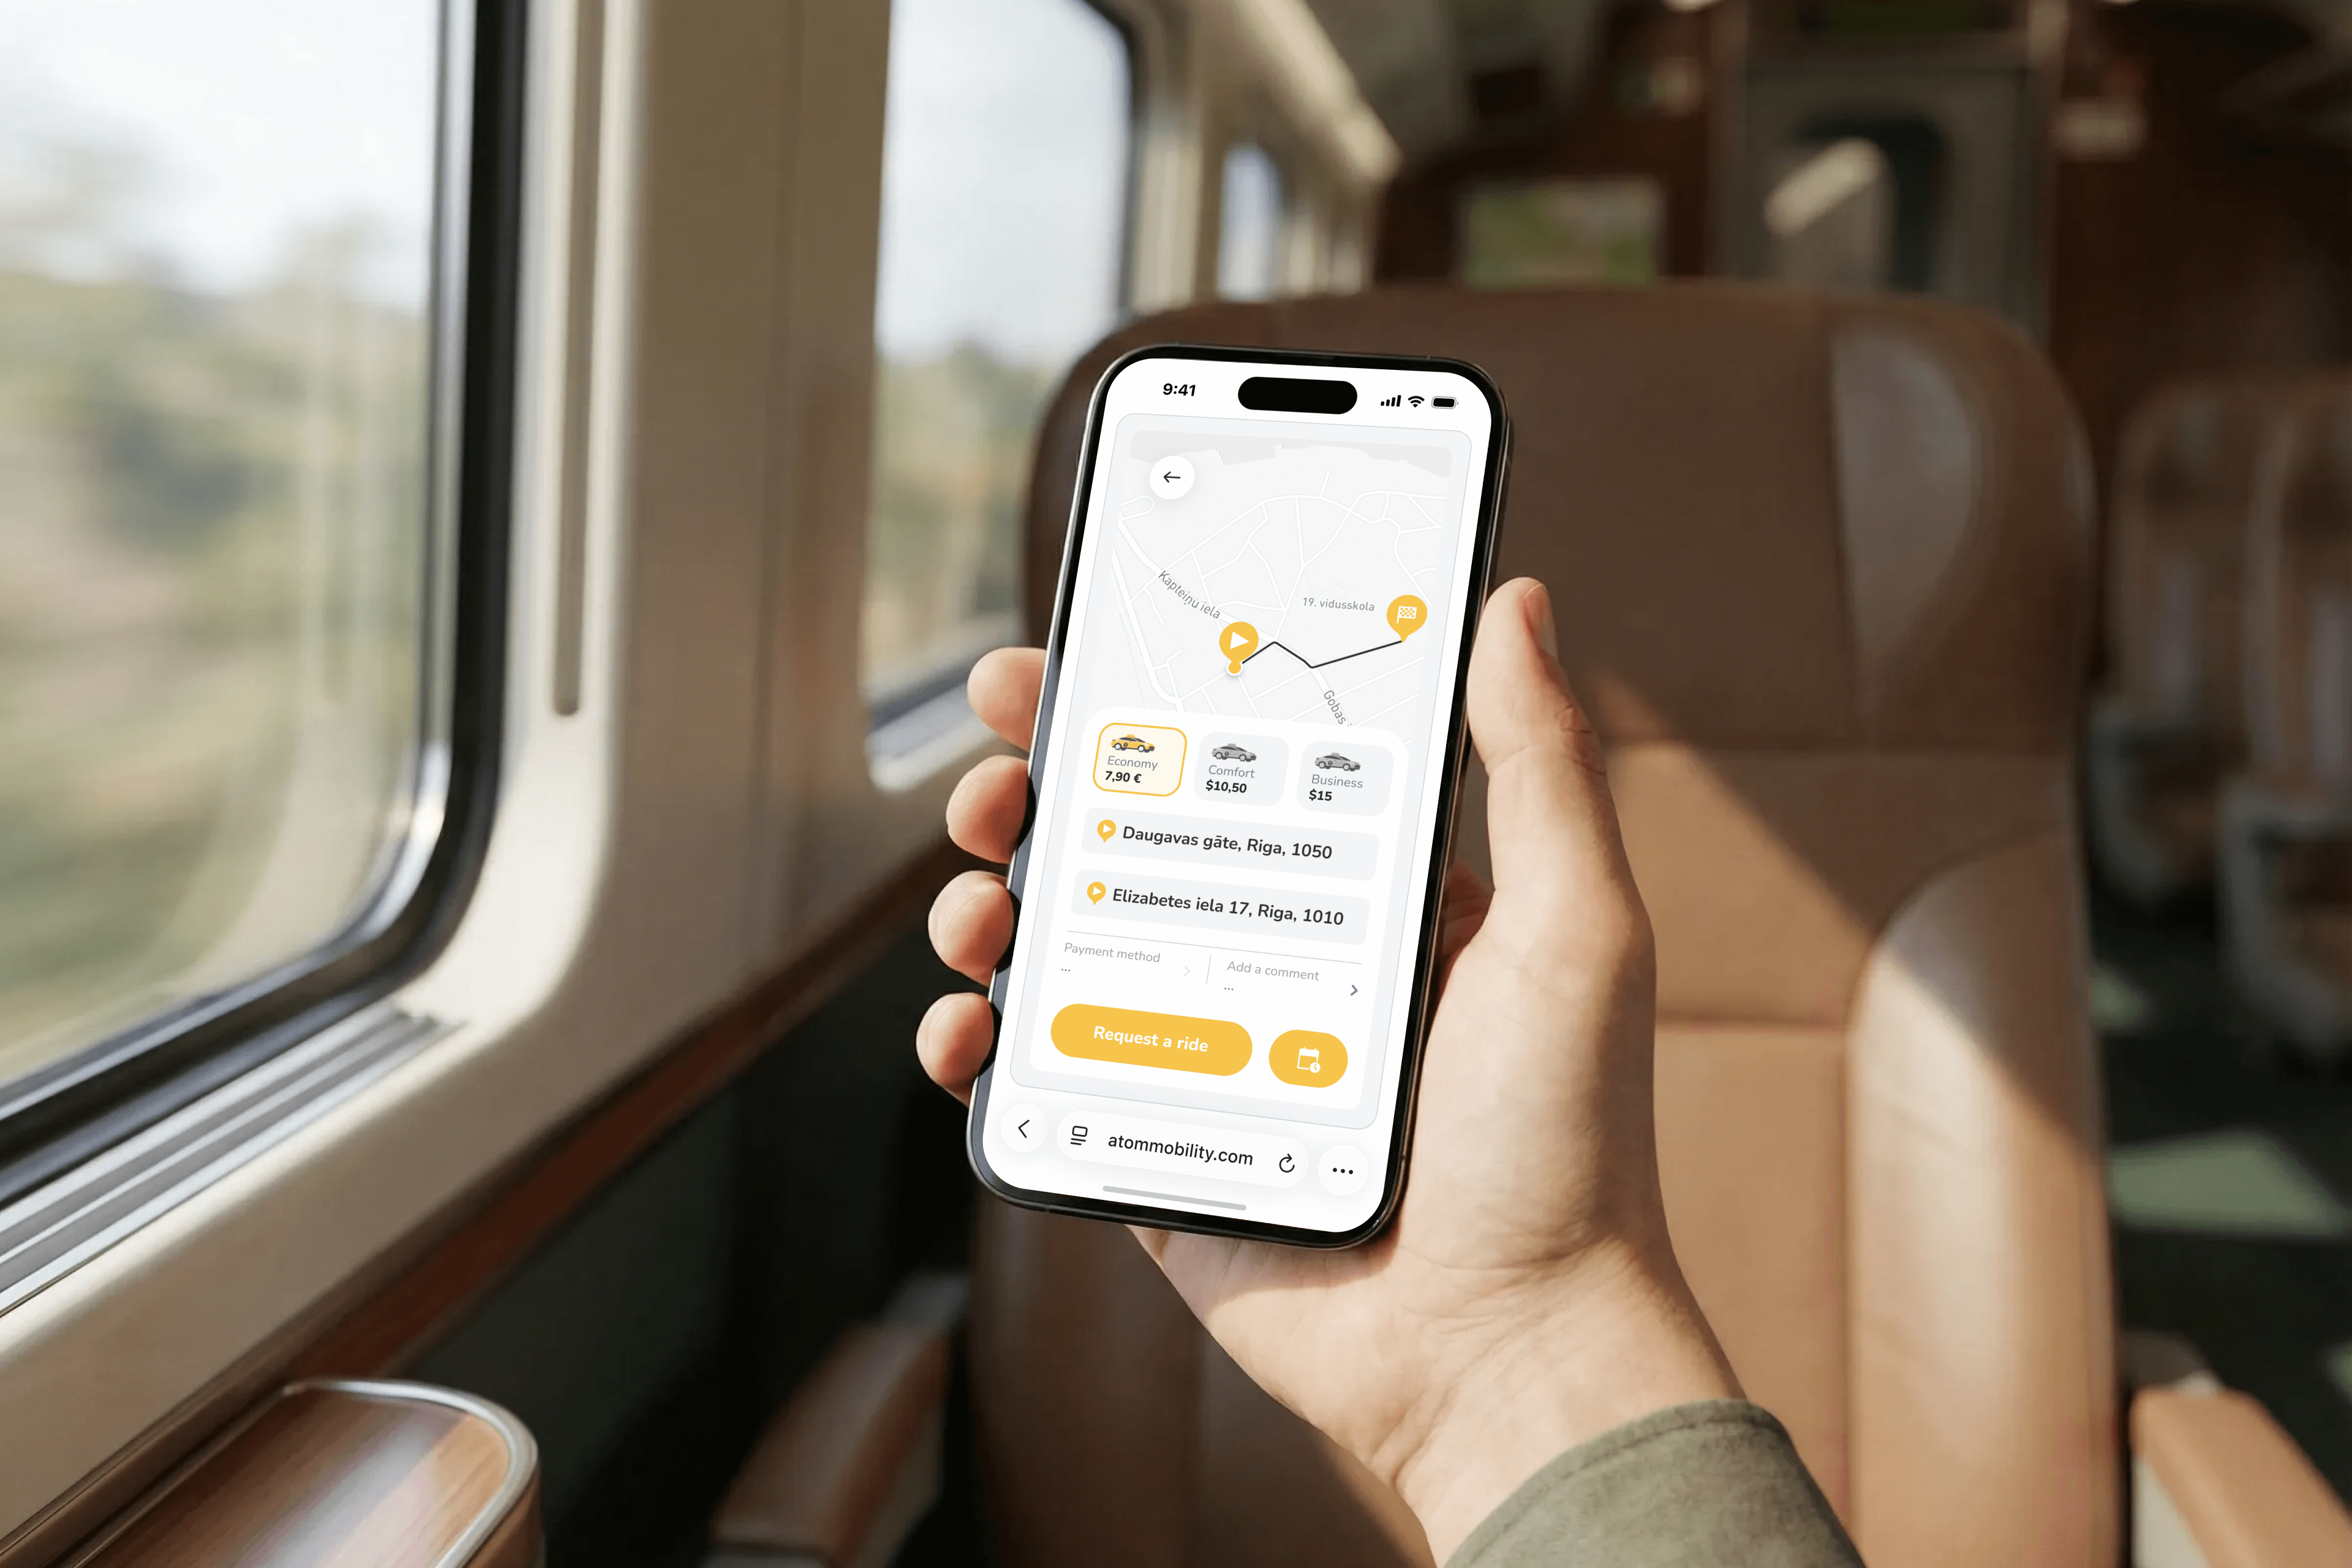
Many taxi businesses still focus only on app installs but that is a mistake. Not every rider wants to download an app before booking a ride. This is especially true for airport pickups and tourists in general, hotel guests, older riders, and occasional users. That is why booking flexibility is important. Alongside mobile apps, many operators now add browser-based booking so riders can order without installing anything.
This is what ATOM introduced with its Web Booker for ride-hail, which gives operators a simple way to capture web traffic, direct bookings, and one-time users without forcing an app download.

You need both, drivers and riders, to be interested in your service from day one – drivers will not stick around without rides and riders won’t pick you if there are no available drivers.
That means:
This is one reason local launches tend to perform better than city-wide launches. Smaller launch zones create stronger supply-demand density and better first user experience.
Most taxi businesses fail because not enough people know they exist, not because they lack great technology. Founders often spend months building operations, then treat marketing as something to figure out later, which can become an aspect in which the expenses start rising fast.
You need:
ATOM now offers a dedicated marketing agency for mobility businesses, built specifically for operators who need help acquiring riders, running paid campaigns, and building predictable demand. Without consistent rider acquisition, even a strong product struggles.
Many operators launch with taxis first, then expand into extra services once demand is stable.
That could mean:
This is one of the strongest advantages of launching on flexible mobility software. You are not building a single-use taxi app but a mobility platform that can grow. That is also why ATOM’s ride-hailing platform was built to integrate with broader shared mobility services instead of staying limited to one transport model.
If you’re launching a taxi business, building the right system usually is more important than building a software from scratch. The strongest operators start with a clear market gap, launch with ready-made tools, onboard drivers quickly, give riders flexible booking options, and invest in demand early.
Driver App demo credentials - Email: test@atom.com, Password: driver

