Unmet demand heatmap: Turn missed searches into measurable revenue growth
February 17, 2026
min. read

Fleet operators don’t lose revenue because of lack of demand - they lose it because demand appears in the wrong place at the wrong time. That’s exactly the problem the Unmet demand heatmap solves.
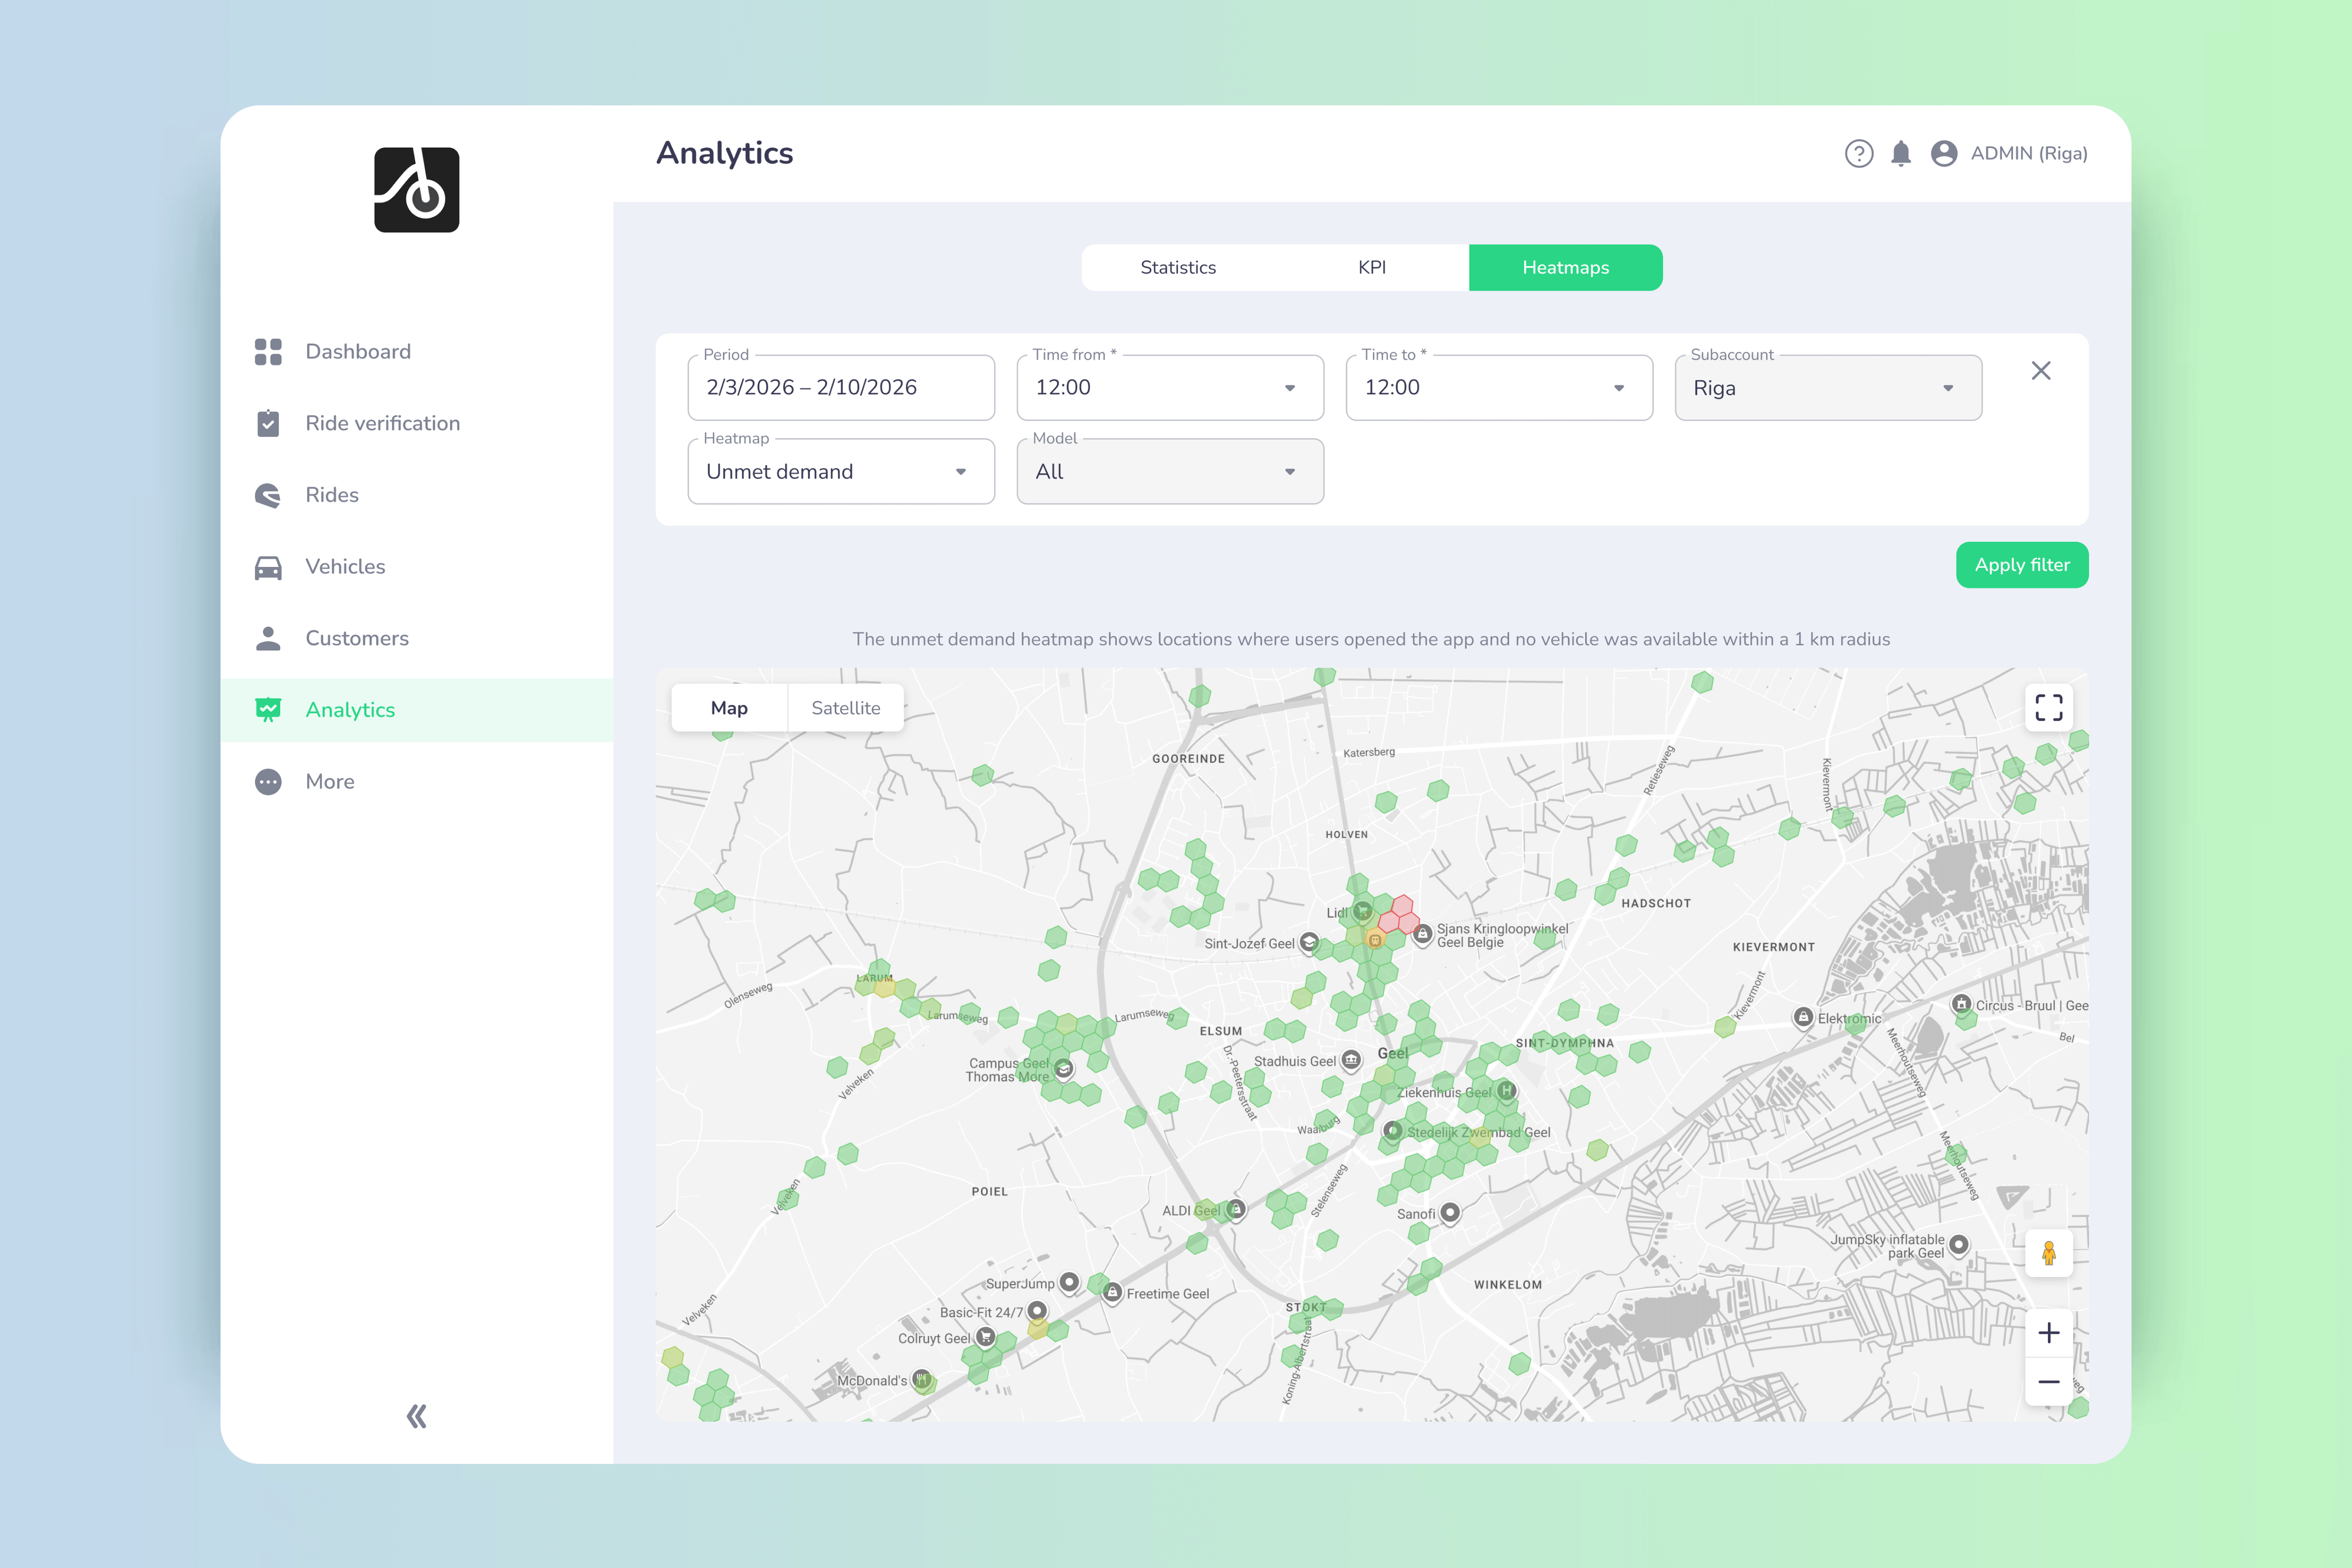
This new analytics layer from ATOM Mobility shows where users actively searched for vehicles but couldn’t find any within reach. Not guesses. Not assumptions. Real, proven demand currently left on the table.
The unmet demand heatmap highlights locations where:
In other words: high-intent users who wanted to ride, but couldn’t. Unlike generic “app open” data, unmet demand is recorded only when a real vehicle search happens, making this one of the most actionable datasets for operators.
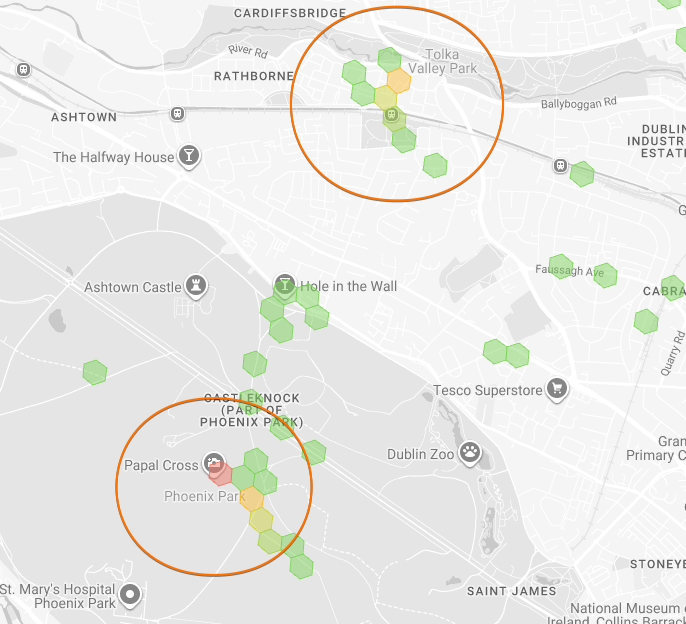
Many analytics tools track where users open the app (ATOM Mobility provides this data too). That’s useful - but incomplete. Unmet demand answers a much stronger question:
Where did users try to ride and failed? That difference matters.
Unmet demand data is:
✅ Intent-driven (search-based, not passive)
✅ Directly tied to lost revenue
✅ Immediately actionable for rebalancing and expansion
✅ Credible for discussions with cities and partners
Here’s how the logic is implemented under the hood:
1. Search-based trigger. Unmet demand is recorded only when a user performs a vehicle search. No search = no data point.
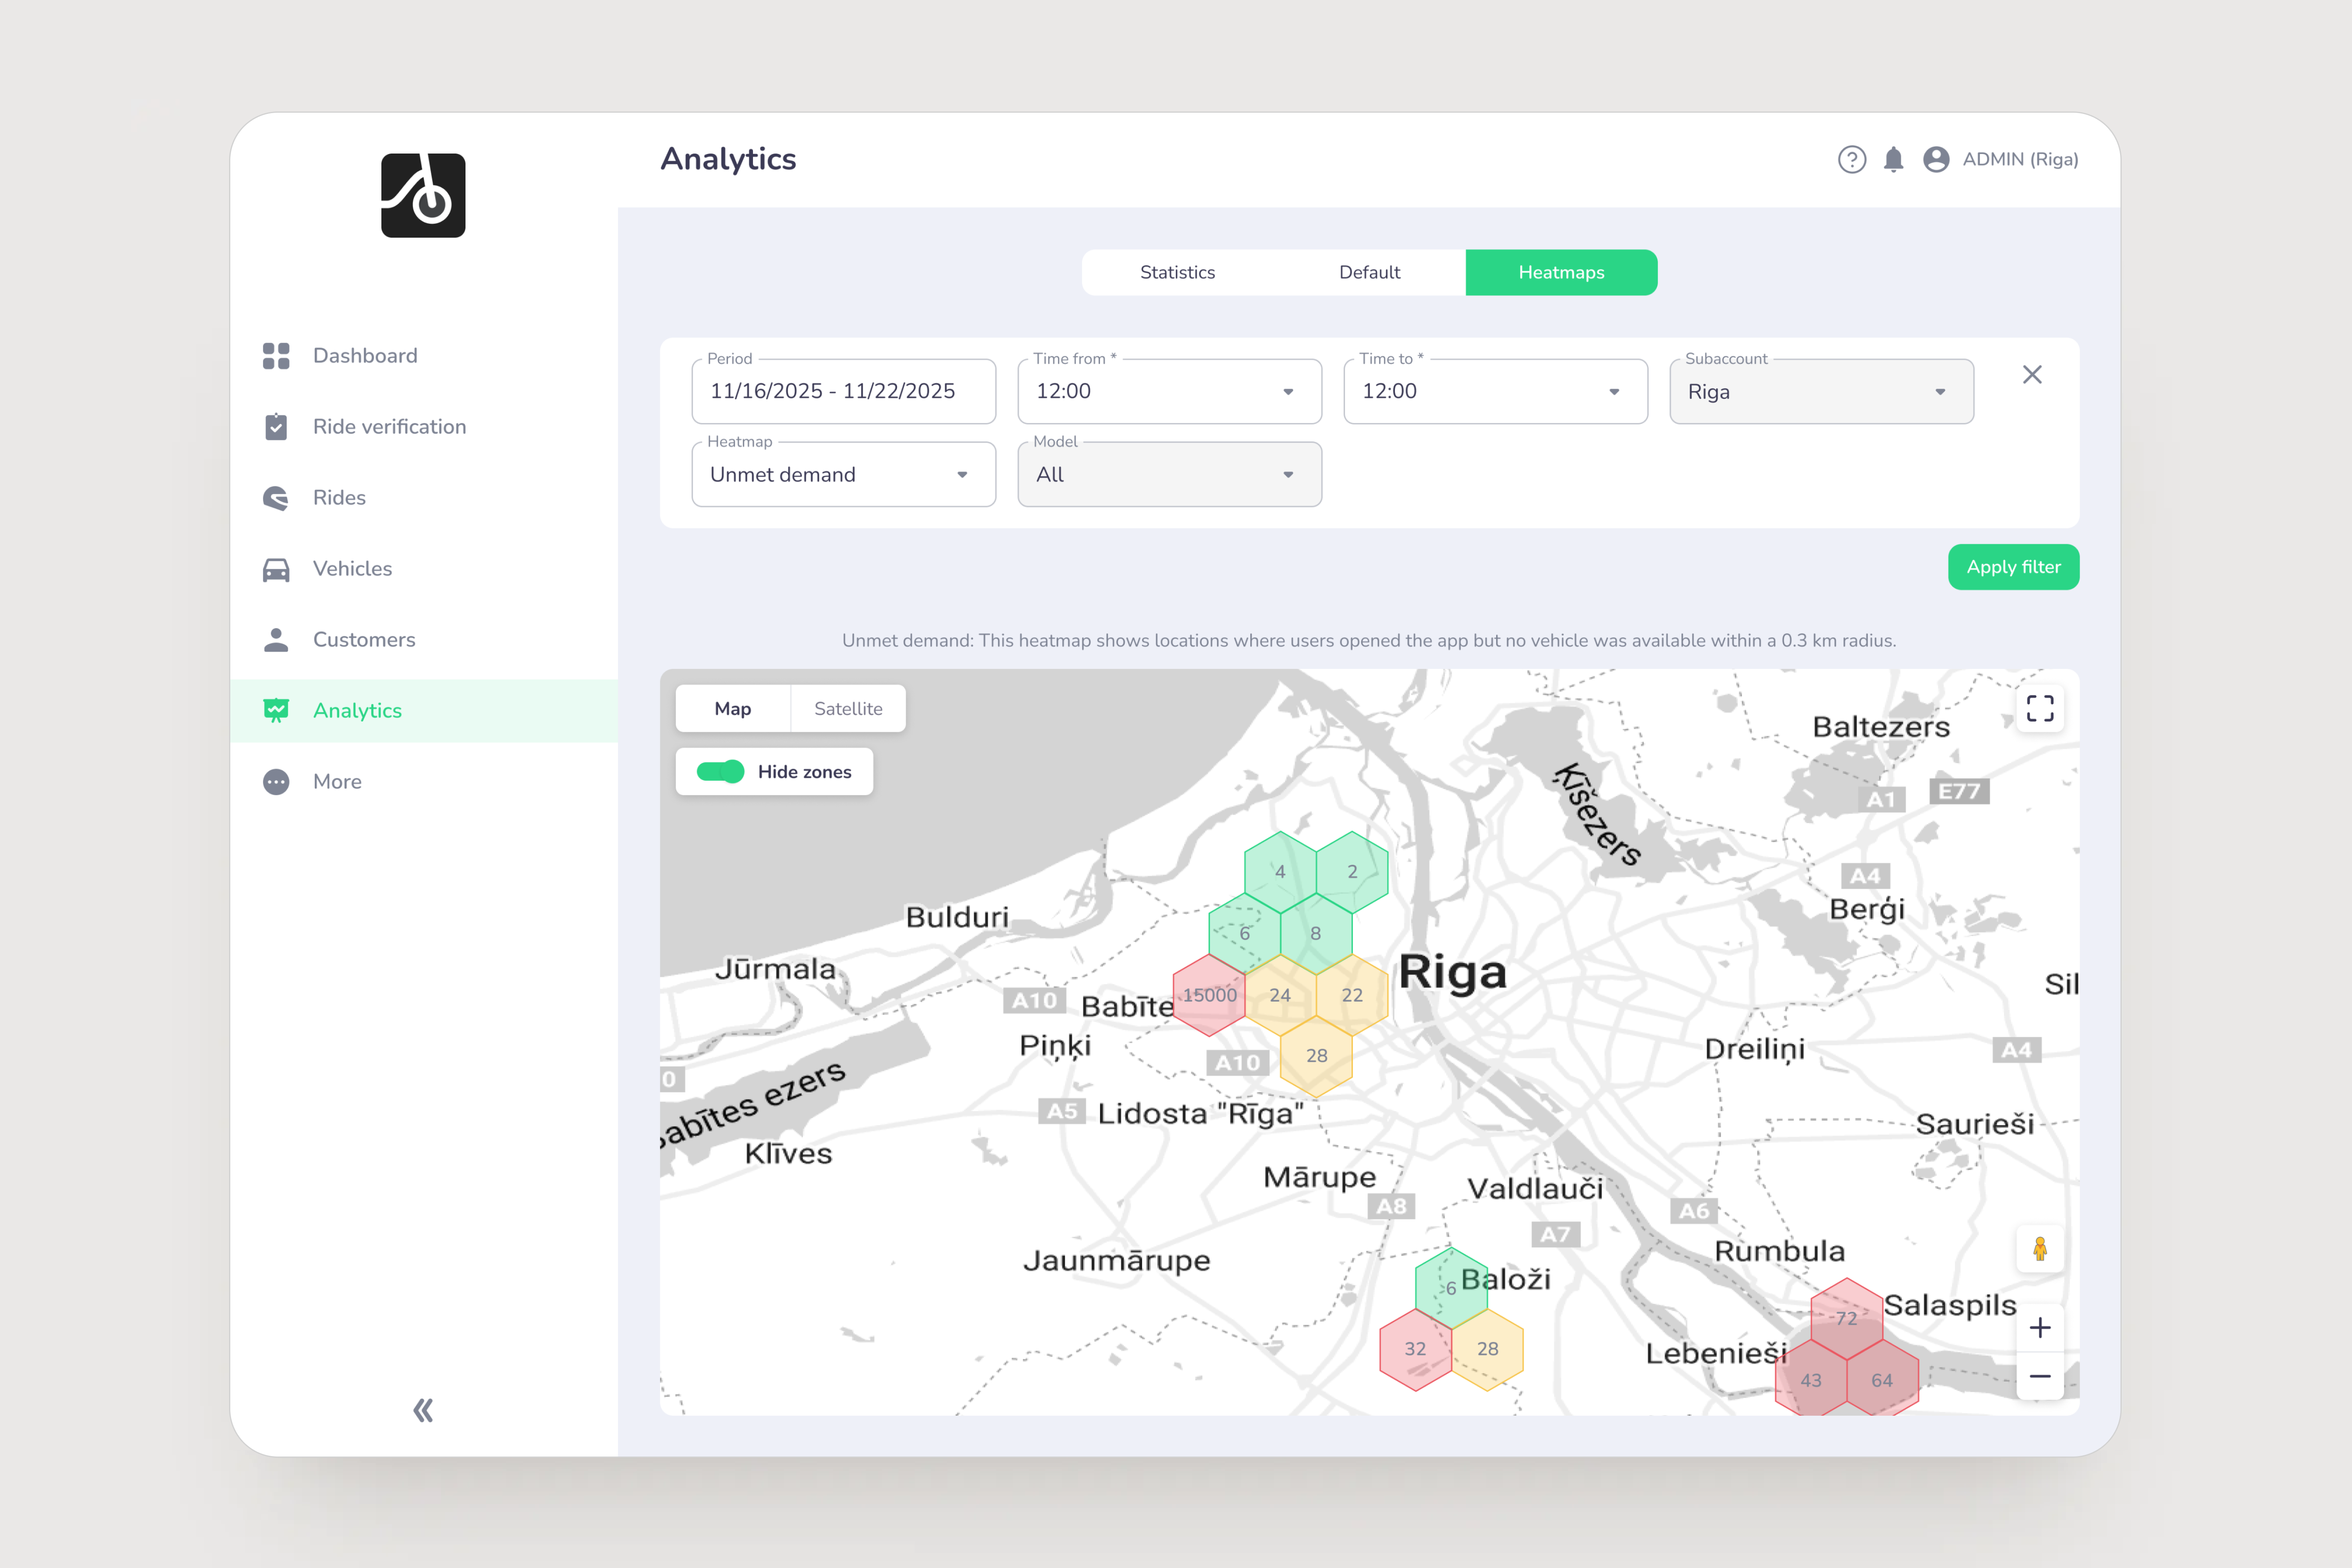
2. Distance threshold. If no vehicle is available within 1,000 meters, unmet demand is logged.
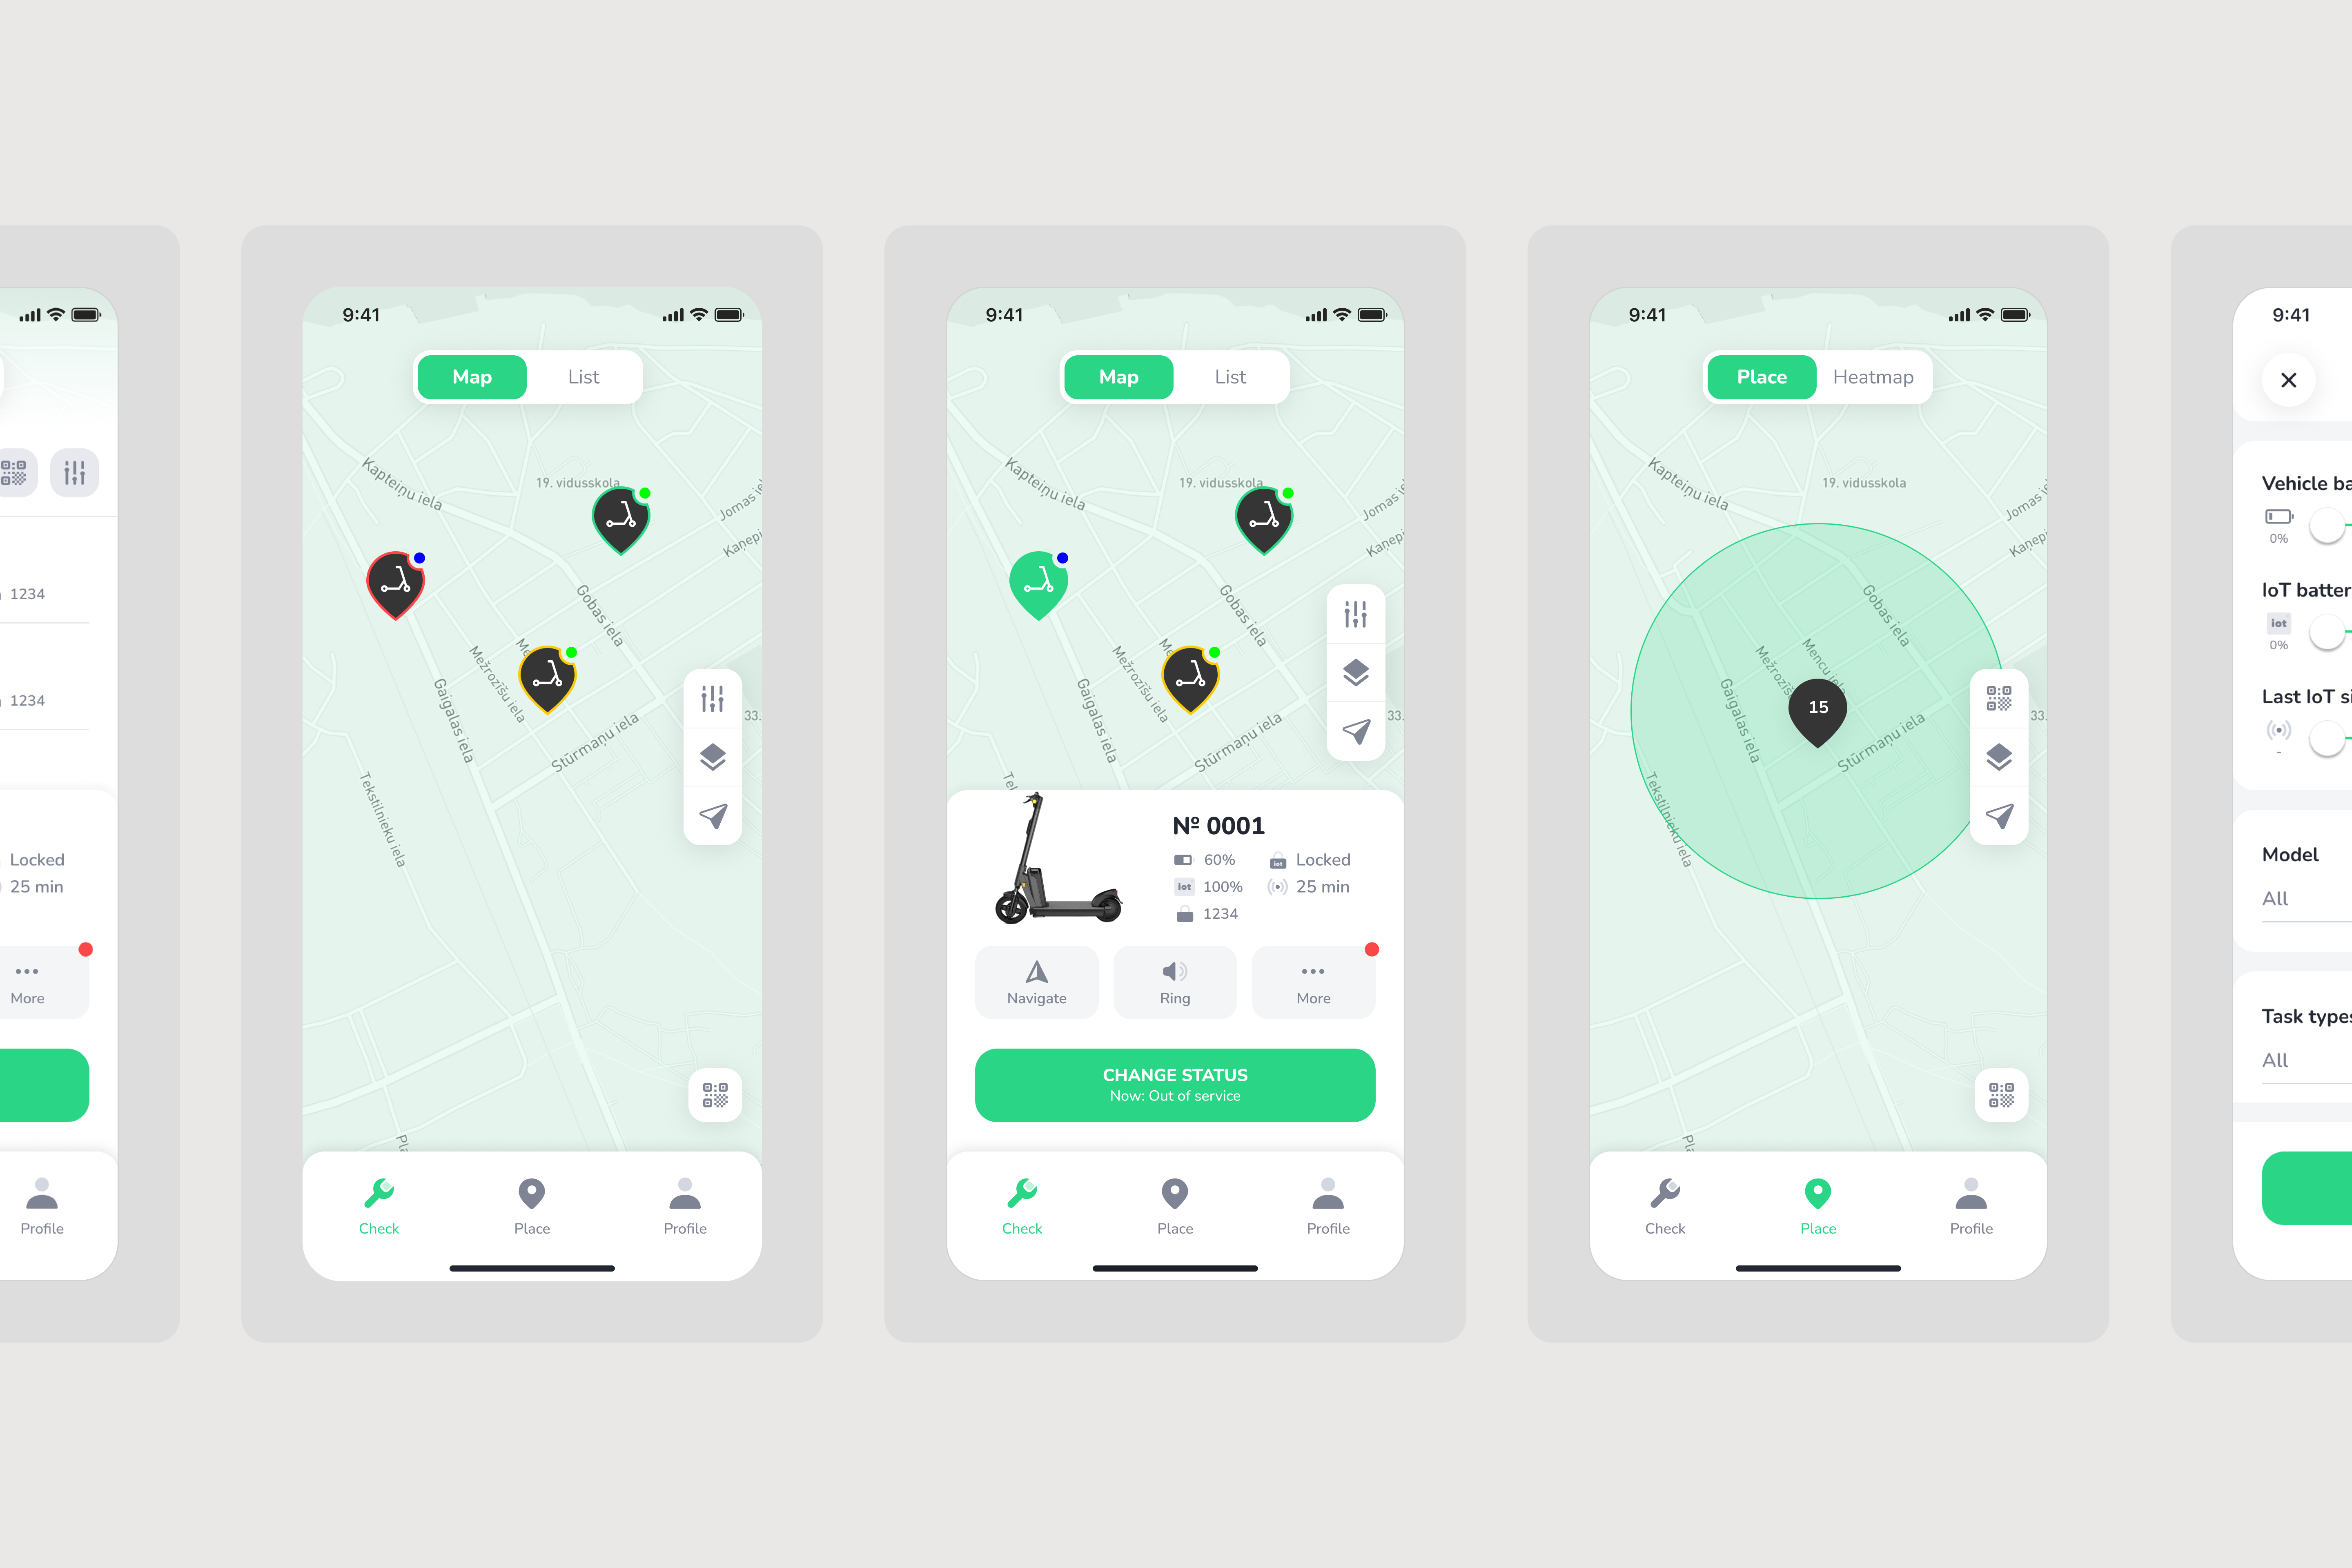
3. Shared + private fleet support. The feature tracks unmet demand for:
This gives operators a full picture across all use cases.
4. GPS validation. Data is collected only when:
This ensures accuracy and avoids noise.
To prevent multiple searches from the same user artificially inflating demand, the system applies intelligent filtering:
- After a location is stored, a 30-minute cooldown is activated
- If the same user searches again within 30 minutes And within 100 meters of the previous location → the record is skipped
- After 30 minutes, a new record is stored - even if the location is unchanged
Result: clean, realistic demand signals, not spammy heatmaps.
Unmet demand shows exactly where vehicles are missing allowing you to:
🚚 Smarter rebalancing
Instead of guessing where to move vehicles, teams can prioritize:
🏙 Stronger city conversations
Unmet demand heatmaps are powerful evidence for:
📊 Higher conversion rates
Placing vehicles where users actually search improves:
The new unmet demand heatmap is designed to work alongside other analytics layers, including:
- Popular routes heatmap
- Open app heatmap
- Start & end locations heatmap
Operators can also:
Every unmet search is a signal. Every signal is a potential ride. Every ride is revenue. With the unmet demand heatmap, operators stop guessing and start placing vehicles exactly where demand already exists.
👉 If you want to see how unmet demand can unlock growth for your fleet, book a demo with ATOM Mobility and explore how advanced heatmaps turn data into decisions.
🚲 The biggest costs in shared mobility are often the ones riders never see. Behind every trip is a constant cycle of fleet balancing, maintenance, charging, customer support, and compliance. As fleets grow, these operational costs can have a bigger impact on profitability than the vehicles themselves. This article explores the hidden costs that shape every shared mobility business.
Shared mobility often looks simple from the outside. A user opens an app, unlocks a vehicle, completes a trip, and moves on with their day. But not everybody knows that the system behind every ride is a bit more complex and can be quite expensive. For many operators, the biggest expenses are not always the most obvious ones.
As shared mobility continues to grow across Europe, operators face increasing pressure to improve efficiency while maintaining service quality. According to the latest European Shared Mobility Index, shared mobility services generated more than 700 million trips across Europe in 2025, reflecting continued demand for alternative transportation options. At the same time, profitability remains one of the industry's biggest challenges.
Across more than 300 shared mobility projects worldwide, one pattern appears consistently: operators often underestimate operational costs during launch planning while focusing primarily on fleet acquisition, permits, and launch activities. The largest challenges often emerge later through day-to-day operations, where downtime, fleet balancing, maintenance, customer support, and compliance costs gradually impact profitability.
Every shared vehicle is an asset that only generates revenue when it is available to users. A scooter waiting for repairs, a bike with a flat tire, or a car that has not been inspected after damage generates no revenue at all. For example, a scooter generating an average of two rides per day at €3 per ride produces roughly €2,200 in annual revenue. If recurring maintenance issues keep that vehicle unavailable for two weeks each quarter, the shared mobility operator could lose more than €250 in annual revenue from that vehicle alone. Across hundreds or thousands of vehicles, downtime quickly becomes a significant operational cost.
Yet the costs continue to build up – insurance, depreciation, financing, storage, and operational overhead do not stop simply because a vehicle is unavailable.
This becomes particularly noticeable as fleets grow. A single inactive vehicle may not seem significant but hundreds of inactive vehicles spread across multiple cities quickly become a major financial problem.
That is why many operators invest heavily in fleet visibility and operational tools. Platforms such as ATOM Mobility's vehicle sharing software help operators monitor vehicle status in real time and identify issues before they affect large parts of the fleet.
One of the least visible costs in shared mobility is fleet redistribution. Users naturally travel between different parts of a city. Over time, vehicles begin clustering in some areas while disappearing from others. The result is familiar to most operators – too many vehicles where demand is low and not enough where demand is highest. Solving this problem requires people, vehicles, planning, and technology. Large operators often maintain dedicated teams responsible for things like fleet redistribution, battery swapping, charging operations, station monitoring and demand forecasting.
Academic studies of bike-sharing systems consistently identify balancing and redistribution as some of the biggest operational challenges because they directly affect both utilisation and customer satisfaction. When users cannot find a vehicle nearby, they often choose another transport option instead. It’s even more difficult during big events, tourist seasons, weather changes, and rush hours when demand patterns shift rapidly.
For operators managing electric scooters, bikes, and mopeds, battery charging creates another layer of operational complexity. Vehicles must be collected, charged, swapped, and returned to high-demand locations. Labour, logistics, warehouse space, charging infrastructure, and electricity costs all contribute to the overall cost of fleet operations.
As fleets grow, charging efficiency becomes increasingly important. Poor battery management can increase downtime, reduce vehicle availability, and create unnecessary operational costs. For operators managing thousands of electric vehicles, charging and battery-swapping operations can require dedicated teams, warehouses, charging infrastructure, and specialised software to coordinate daily tasks efficiently.
Most vehicle problems start as minor issues but then become a bigger problem. A slightly damaged brake, a worn tire, a loose component, or a battery performing below normal levels may not immediately remove a vehicle from service. Left unresolved, however, these issues often become larger repairs that require more time, more money, and more operational effort.
For this reason, maintenance is no longer viewed as a reactive task by many successful operators. Instead, it is becoming an ongoing operational process supported by automation, diagnostics, and task management systems. So it’s important to identify problems before users do.
Many operators are moving toward more structured maintenance workflows, similar to the approaches discussed in ATOM Mobility's fleet management automation insights.
Customer support is often not thought enough about during launch planning. Founders typically focus on vehicles, apps, and pricing. Few spend enough time calculating the operational cost of helping users when things go wrong.
Support requests usually involve payment issues, failed unlock attempts, damaged vehicles, parking questions, account verification, trip disputes and other day to day problems. A fleet generating 100,000 monthly rides may receive hundreds or even thousands of support requests related to payments, parking violations, damaged vehicles, or account verification.
The cost of poor support is often higher than the cost of support itself because unresolved issues directly affect retention and reviews.
The shared mobility industry has grown significantly. A decade ago, many cities welcomed operators with relatively few requirements. Today, most cities expect detailed reporting, parking compliance, safety measures, accessibility standards, and operational transparency.
Operators increasingly need to invest in:
These requirements create additional costs, but they are quickly becoming part of doing business in the sector. At the same time, cities are becoming more selective about which operators receive permits and long-term partnerships, making operational quality an increasingly important competitive advantage.
Hidden costs rarely appear in business plans or launch announcements. They emerge gradually through downtime, maintenance, balancing, customer support, charging operations, and compliance requirements. Individually, each cost may seem manageable. Together, they often determine whether a mobility business becomes profitable.
Shared mobility businesses often talk about fleet size, market expansion, and trip volume. The operators that build sustainable businesses tend to focus on a different set of metrics, including vehicle utilisation, downtime, maintenance efficiency, and operational automation. Growth still matters, but it becomes expensive quickly when operational control is lacking.
Across the shared mobility industry, operational excellence is increasingly becoming a stronger competitive advantage than fleet size alone.
Many of the hidden costs discussed in this article can be reduced through better operational visibility and automation. Modern mobility management platforms help operators monitor fleet health, detect issues before they lead to downtime, automate maintenance workflows, prioritise field operations, optimise redistribution using real-time demand data, coordinate charging and battery-swapping activities, automate refunds for unsuccessful rides, and generate compliance reports with no manual effort.
At ATOM Mobility, we've seen these challenges across more than 300 shared mobility projects worldwide. While every market is different, operators that invest in operational efficiency early are often better positioned to achieve sustainable growth and profitability.

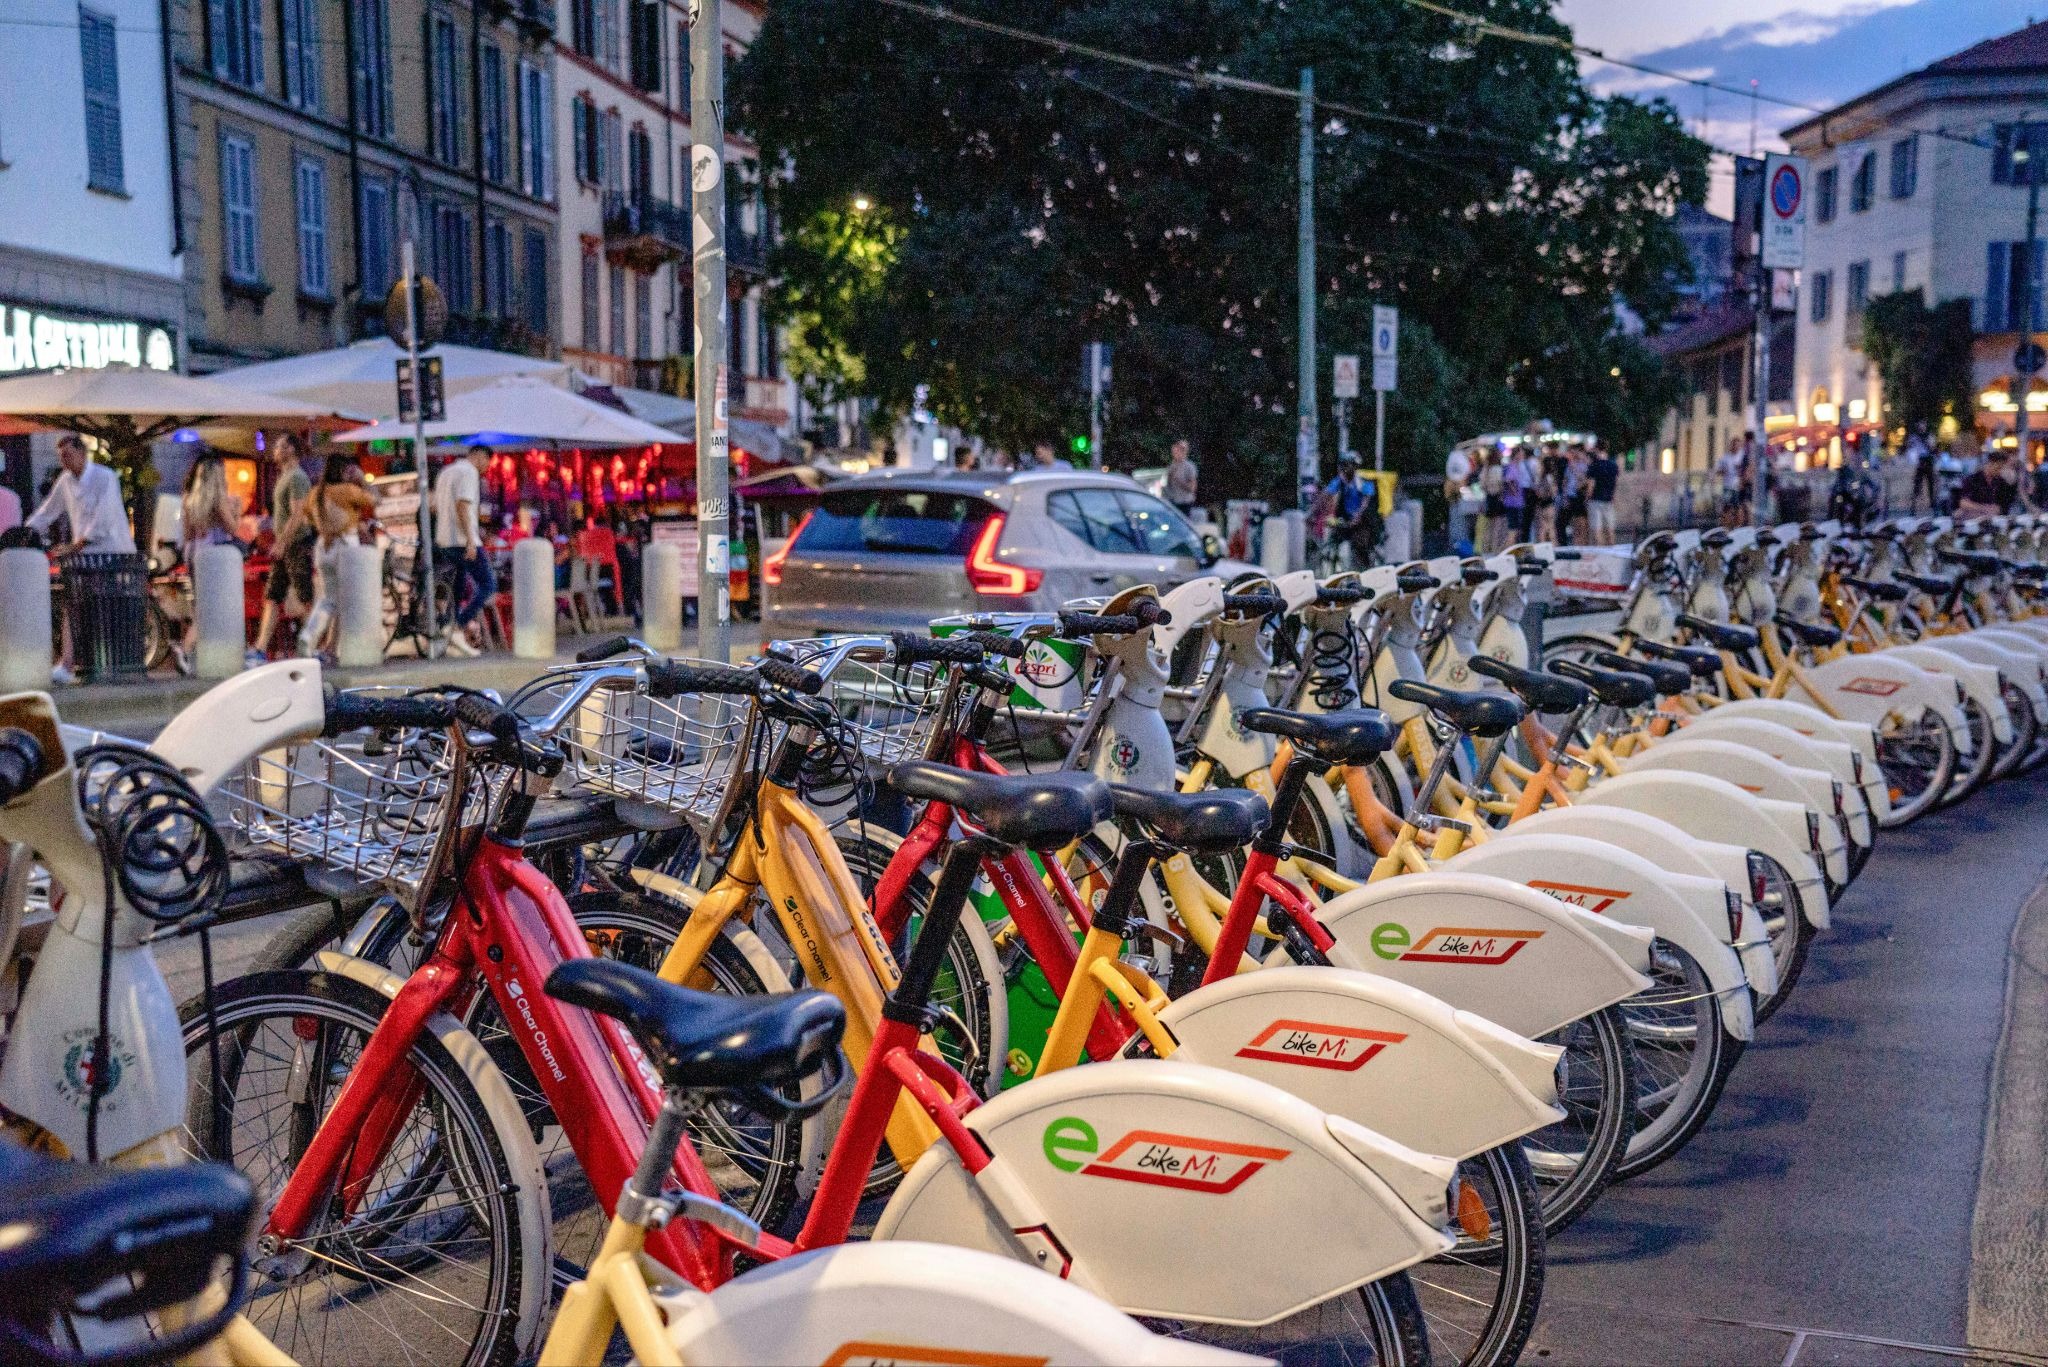
🚲 While dockless scooters and e-bikes often seems to be the popular choice, many of Europe's most popular shared mobility programs are station-based bike-sharing networks. Systems like Vélib' in Paris, Bicing in Barcelona, and BikeMi in Milan continue to grow by combining predictable parking, strong integration with public transport, and increasingly popular e-bike fleets. What these programs have in common, how they operate at scale, and why many cities continue investing in station-based bike sharing?
During 2019-2025, most of the attention in shared mobility went to dockless scooters. They were quick to deploy, highly visible, and seemed like the future of urban transport. But while many scooter operators expanded, consolidated, or exited markets, station-based bike-sharing systems quietly continued growing.
According to the 2025 European Shared Mobility Index, public bike-sharing schemes generated around 238 million trips in Europe, while private bike-sharing operators recorded another 124 million trips. Together, bike-sharing services accounted for more than 360 million annual rides out of more than 700 million rides (the other half was generated by free-floating scooters). While the industry spent years experimenting with different models, station-based bike sharing remained remarkably resilient. In many cities, it has become part of everyday transport infrastructure rather than simply another mobility service.
One of the clearest themes from the latest index is that the market is becoming more disciplined. Operators are no longer chasing every possible market. Instead, they are focusing on locations where shared mobility can operate sustainably over the long term. Cities are becoming more selective too, favouring systems that fit into wider transport networks rather than uncontrolled fleet expansion.
This shift has created favourable conditions for station-based bike-sharing systems. Unlike dockless fleets, station-based programs offer more predictable parking, easier fleet management, and stronger integration with public transport. These advantages become increasingly important as cities focus more on accessibility, compliance, and long-term mobility planning.
The strongest argument for station-based bike sharing is the performance of some of the world's largest programs.
Paris' Vélib' remains one of the most successful bike-sharing systems in Europe. The network combines thousands of regular bicycles and e-bikes across an extensive station network that covers much of the city. Vélib' generated approximately 48.5 million trips in 2025, making it the highest-ridership public bike-sharing system in Europe.
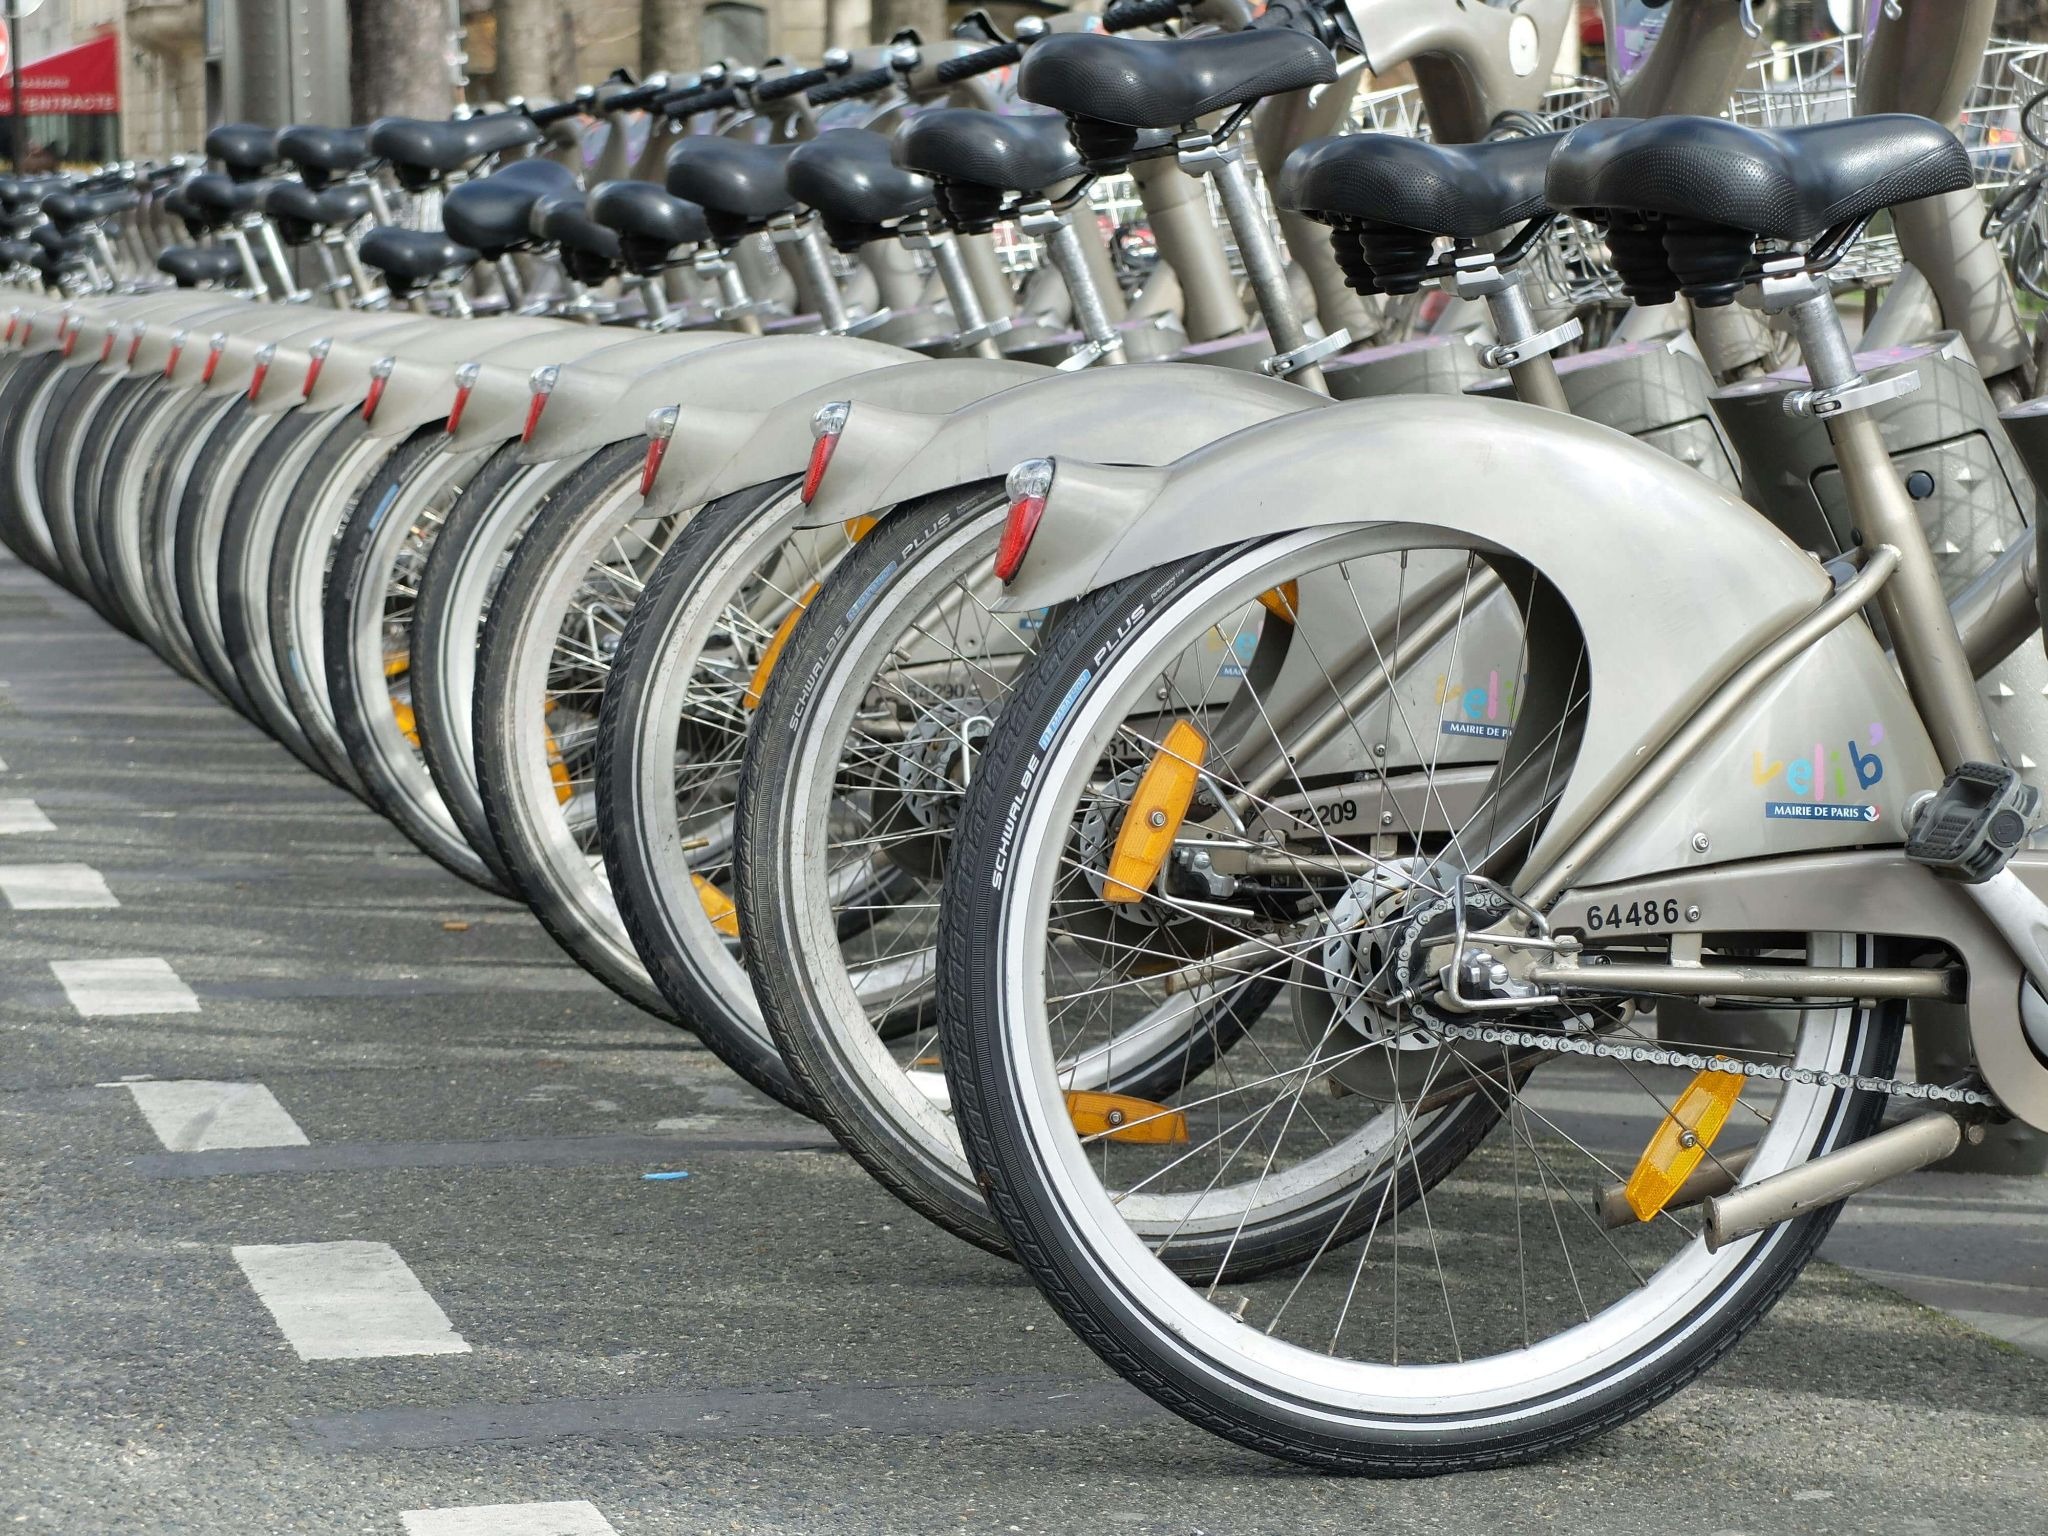
What makes Vélib' particularly interesting is that, for many Parisians, it has become part of their daily commute alongside buses, metros, and trains. That level of adoption only happens when riders know they can reliably find and return bikes where they need them.
Barcelona's Bicing demonstrates how station-based systems can scale with city support and careful planning. The system combines regular bicycles and e-bikes and has become deeply integrated into the city's transport ecosystem. Bicing recently surpassed 100 million total rides, making it one of the most successful public bike-sharing programs globally. Barcelona is becoming a fascinating mobility case study: shared scooters were banned, private dockless bike-sharing is being phased out, while the city continues expanding the public Bicing network. A clear signal that some cities are prioritizing station-based and publicly managed micromobility over free-floating models.
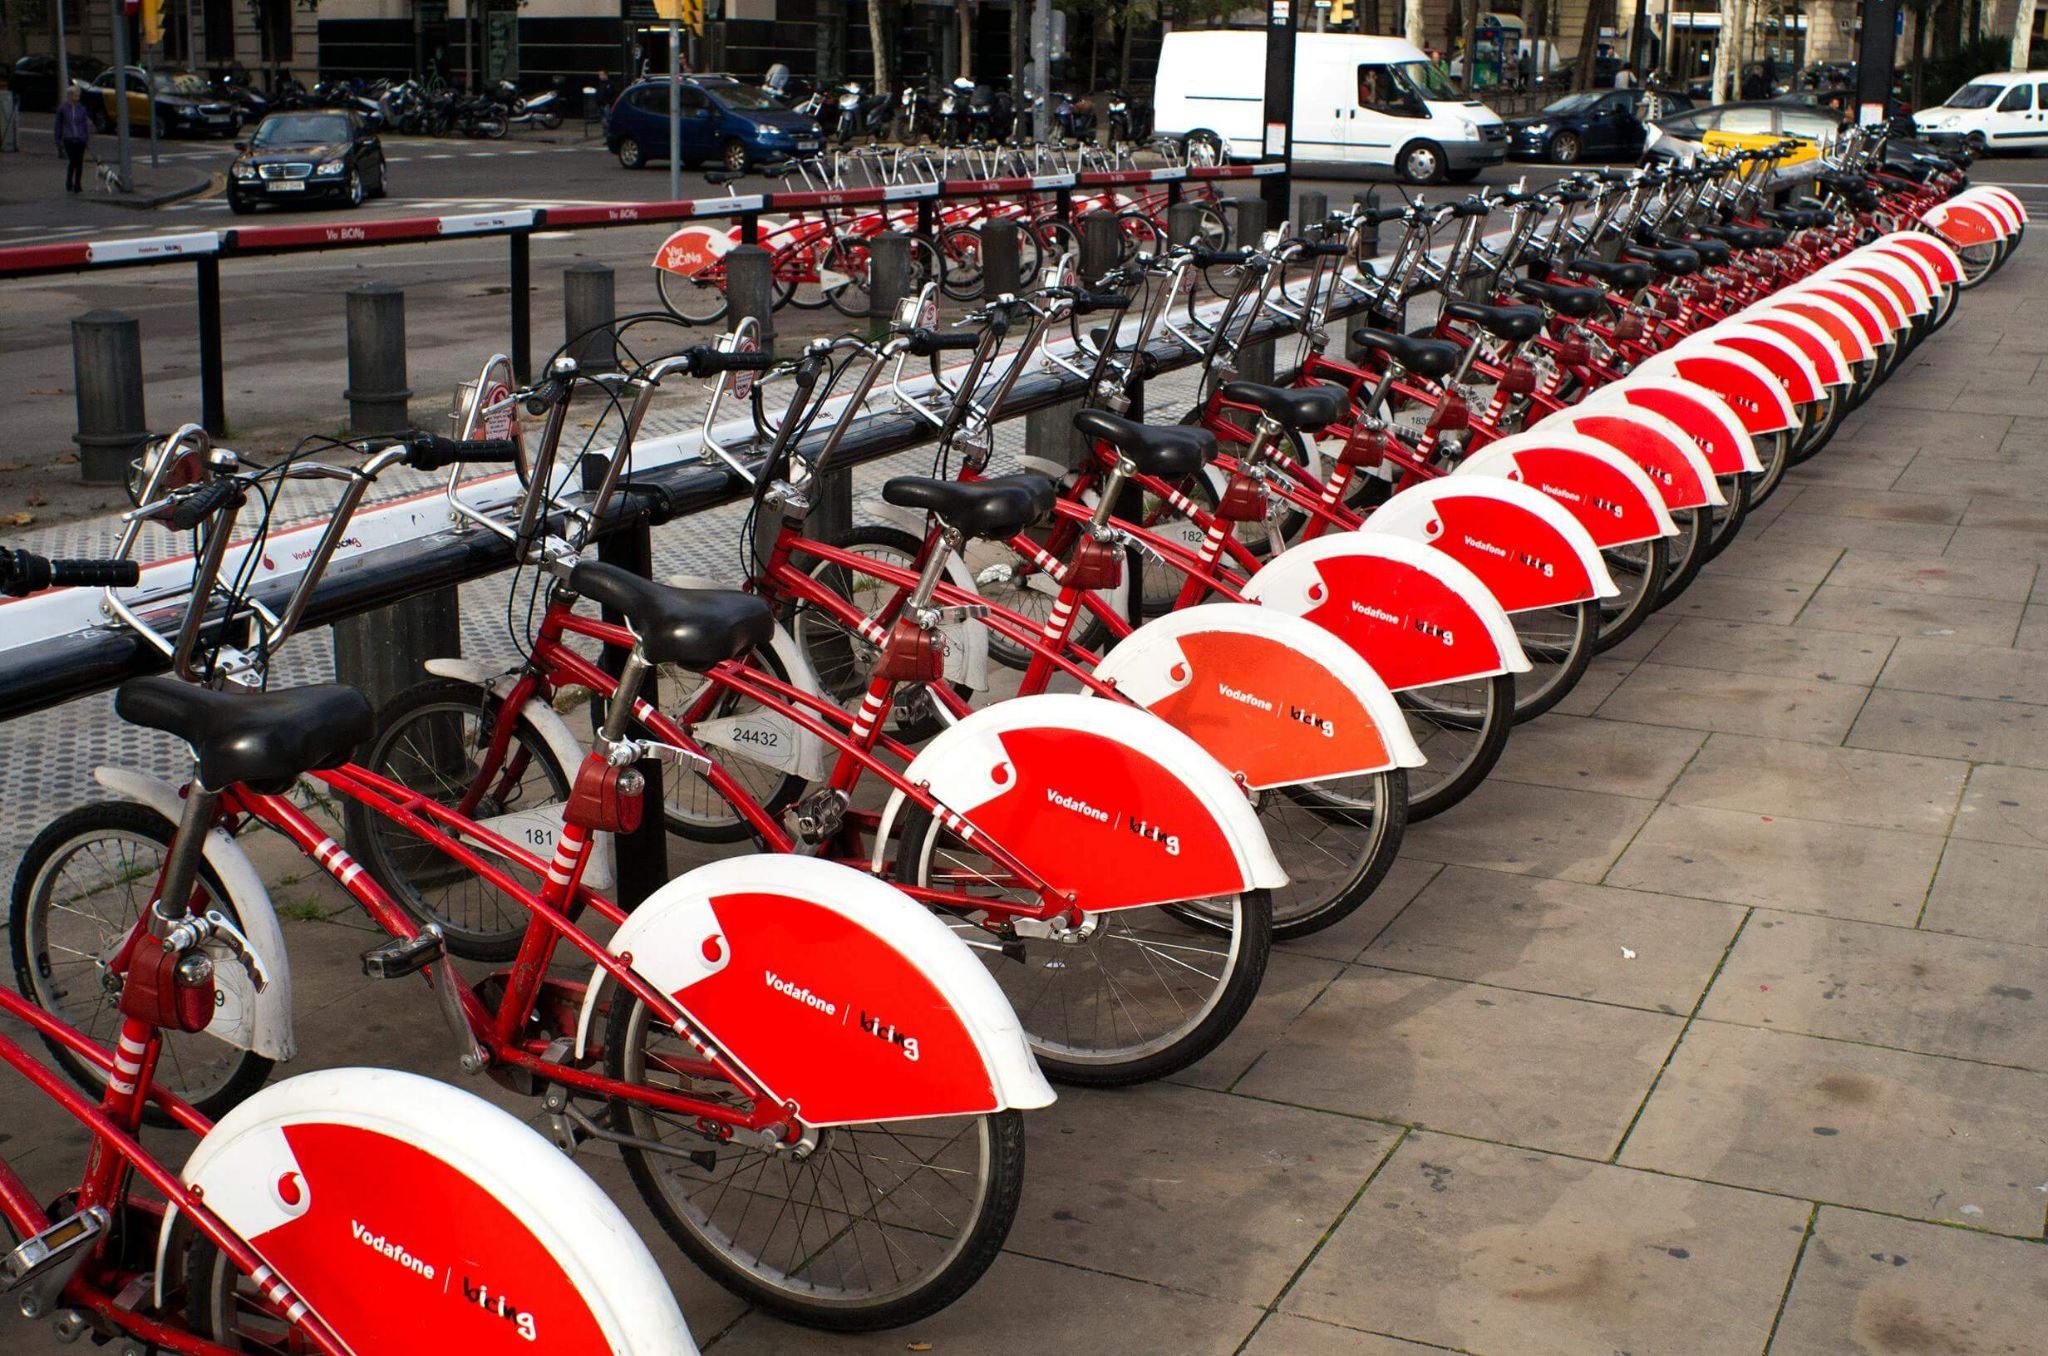
The success of Bicing also reflects a broader trend in Spain, where public bike-sharing systems continue receiving strong institutional support.
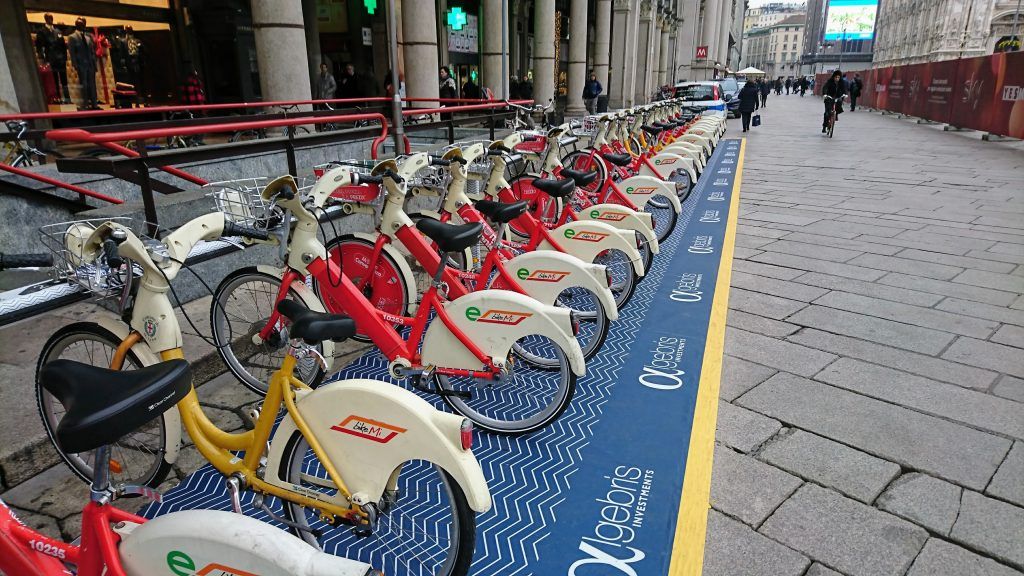
BikeMi in Milan offers a slightly different model. Rather than focusing on rapid expansion, the system grew steadily through dense station placement, strong commuter adoption, and integration with public transport. Now BikeMi combines traditional bicycles and e-bikes, providing a reliable transport option for both residents and visitors. Its success highlights an important lesson for operators: long-term utilisation often matters more than rapid fleet growth.
Although Vélib', Bicing, and BikeMi differ in scale and geography, they share several common characteristics. All three prioritise station density, integration with city transport networks, and predictable rider experiences.
One of the biggest developments in station-based bike sharing over the past few years has been the rapid growth of electric fleets. Public bike-sharing fleets are now approximately 48% electrified. More importantly for operators, electric bikes consistently generate more trips than traditional bicycles. Public systems average around 2.7 trips per vehicle per day, while some electric bike fleets achieve up to 4.6 trips per vehicle per day.
Higher utilisation means more revenue per vehicle, a faster return on investment, lower idle fleet costs, and stronger demand throughout the day. Electric bikes also make bike sharing accessible to a broader audience. Longer distances become practical, hills become less of a barrier, and riders who would not normally choose a bicycle are often willing to use an e-bike instead. This is one reason many newer station-based systems are launching with mixed fleets or even fully electric fleets from day one.
Across Europe, municipalities are placing greater emphasis on organised mobility systems that can be integrated into existing transport networks. The European Shared Mobility Index highlights several examples, including public support programs for bike-sharing subscriptions in Spain, continued investment in Barcelona's Bicing network, and London's decision to renew its Santander Cycles contract through a long-term investment programme.
For cities, the appeal is relatively clear. Station-based systems provide predictable parking, reduce street clutter, simplify accessibility planning, and make it easier to integrate bike sharing with buses, trains, and metro systems. As regulations become stricter and public space becomes more valuable, these advantages are becoming increasingly important.
As fleets grow, operators need visibility into station occupancy, vehicle availability, charging status, maintenance workflows, payments, rider activity, and customer support. Managing these processes manually quickly becomes difficult, especially when systems expand across multiple districts or cities.
Many operators use platforms such as ATOM Mobility's bike-sharing software to manage stations, vehicles, rider applications, payments, maintenance, and operational workflows through a single system rather than relying on multiple disconnected tools. The largest station-based programs did not become successful simply because they deployed more bikes. They built operational processes capable of supporting growth over many years.
The growth of systems like Vélib', Bicing, and BikeMi suggests that station-based bike sharing has found its place in modern cities long-term. The focus now is less on expansion alone and more on operating reliable, efficient networks that riders can depend on every da
Check out the full 2025 European Shared Mobility Index here: https://fluctuo.com/reports
Driver App demo credentials - Email: test@atom.com, Password: driver

