Blog
Insights and news from the ATOM Mobility team
We started our blog to share free valuable information about the mobility industry: inspirational stories, financial analysis, marketing ideas, practical tips, new feature announcements and more.

We started our blog to share free valuable information about the mobility industry: inspirational stories, financial analysis, marketing ideas, practical tips, new feature announcements and more.
🚲 The biggest costs in shared mobility are often the ones riders never see. Behind every trip is a constant cycle of fleet balancing, maintenance, charging, customer support, and compliance. As fleets grow, these operational costs can have a bigger impact on profitability than the vehicles themselves. This article explores the hidden costs that shape every shared mobility business.
Shared mobility often looks simple from the outside. A user opens an app, unlocks a vehicle, completes a trip, and moves on with their day. But not everybody knows that the system behind every ride is a bit more complex and can be quite expensive. For many operators, the biggest expenses are not always the most obvious ones.
As shared mobility continues to grow across Europe, operators face increasing pressure to improve efficiency while maintaining service quality. According to the latest European Shared Mobility Index, shared mobility services generated more than 700 million trips across Europe in 2025, reflecting continued demand for alternative transportation options. At the same time, profitability remains one of the industry's biggest challenges.
Across more than 300 shared mobility projects worldwide, one pattern appears consistently: operators often underestimate operational costs during launch planning while focusing primarily on fleet acquisition, permits, and launch activities. The largest challenges often emerge later through day-to-day operations, where downtime, fleet balancing, maintenance, customer support, and compliance costs gradually impact profitability.
Every shared vehicle is an asset that only generates revenue when it is available to users. A scooter waiting for repairs, a bike with a flat tire, or a car that has not been inspected after damage generates no revenue at all. For example, a scooter generating an average of two rides per day at €3 per ride produces roughly €2,200 in annual revenue. If recurring maintenance issues keep that vehicle unavailable for two weeks each quarter, the shared mobility operator could lose more than €250 in annual revenue from that vehicle alone. Across hundreds or thousands of vehicles, downtime quickly becomes a significant operational cost.
Yet the costs continue to build up – insurance, depreciation, financing, storage, and operational overhead do not stop simply because a vehicle is unavailable.
This becomes particularly noticeable as fleets grow. A single inactive vehicle may not seem significant but hundreds of inactive vehicles spread across multiple cities quickly become a major financial problem.
That is why many operators invest heavily in fleet visibility and operational tools. Platforms such as ATOM Mobility's vehicle sharing software help operators monitor vehicle status in real time and identify issues before they affect large parts of the fleet.
One of the least visible costs in shared mobility is fleet redistribution. Users naturally travel between different parts of a city. Over time, vehicles begin clustering in some areas while disappearing from others. The result is familiar to most operators – too many vehicles where demand is low and not enough where demand is highest. Solving this problem requires people, vehicles, planning, and technology. Large operators often maintain dedicated teams responsible for things like fleet redistribution, battery swapping, charging operations, station monitoring and demand forecasting.
Academic studies of bike-sharing systems consistently identify balancing and redistribution as some of the biggest operational challenges because they directly affect both utilisation and customer satisfaction. When users cannot find a vehicle nearby, they often choose another transport option instead. It’s even more difficult during big events, tourist seasons, weather changes, and rush hours when demand patterns shift rapidly.
For operators managing electric scooters, bikes, and mopeds, battery charging creates another layer of operational complexity. Vehicles must be collected, charged, swapped, and returned to high-demand locations. Labour, logistics, warehouse space, charging infrastructure, and electricity costs all contribute to the overall cost of fleet operations.
As fleets grow, charging efficiency becomes increasingly important. Poor battery management can increase downtime, reduce vehicle availability, and create unnecessary operational costs. For operators managing thousands of electric vehicles, charging and battery-swapping operations can require dedicated teams, warehouses, charging infrastructure, and specialised software to coordinate daily tasks efficiently.
Most vehicle problems start as minor issues but then become a bigger problem. A slightly damaged brake, a worn tire, a loose component, or a battery performing below normal levels may not immediately remove a vehicle from service. Left unresolved, however, these issues often become larger repairs that require more time, more money, and more operational effort.
For this reason, maintenance is no longer viewed as a reactive task by many successful operators. Instead, it is becoming an ongoing operational process supported by automation, diagnostics, and task management systems. So it’s important to identify problems before users do.
Many operators are moving toward more structured maintenance workflows, similar to the approaches discussed in ATOM Mobility's fleet management automation insights.
Customer support is often not thought enough about during launch planning. Founders typically focus on vehicles, apps, and pricing. Few spend enough time calculating the operational cost of helping users when things go wrong.
Support requests usually involve payment issues, failed unlock attempts, damaged vehicles, parking questions, account verification, trip disputes and other day to day problems. A fleet generating 100,000 monthly rides may receive hundreds or even thousands of support requests related to payments, parking violations, damaged vehicles, or account verification.
The cost of poor support is often higher than the cost of support itself because unresolved issues directly affect retention and reviews.
The shared mobility industry has grown significantly. A decade ago, many cities welcomed operators with relatively few requirements. Today, most cities expect detailed reporting, parking compliance, safety measures, accessibility standards, and operational transparency.
Operators increasingly need to invest in:
These requirements create additional costs, but they are quickly becoming part of doing business in the sector. At the same time, cities are becoming more selective about which operators receive permits and long-term partnerships, making operational quality an increasingly important competitive advantage.
Hidden costs rarely appear in business plans or launch announcements. They emerge gradually through downtime, maintenance, balancing, customer support, charging operations, and compliance requirements. Individually, each cost may seem manageable. Together, they often determine whether a mobility business becomes profitable.
Shared mobility businesses often talk about fleet size, market expansion, and trip volume. The operators that build sustainable businesses tend to focus on a different set of metrics, including vehicle utilisation, downtime, maintenance efficiency, and operational automation. Growth still matters, but it becomes expensive quickly when operational control is lacking.
Across the shared mobility industry, operational excellence is increasingly becoming a stronger competitive advantage than fleet size alone.
Many of the hidden costs discussed in this article can be reduced through better operational visibility and automation. Modern mobility management platforms help operators monitor fleet health, detect issues before they lead to downtime, automate maintenance workflows, prioritise field operations, optimise redistribution using real-time demand data, coordinate charging and battery-swapping activities, automate refunds for unsuccessful rides, and generate compliance reports with no manual effort.
At ATOM Mobility, we've seen these challenges across more than 300 shared mobility projects worldwide. While every market is different, operators that invest in operational efficiency early are often better positioned to achieve sustainable growth and profitability.
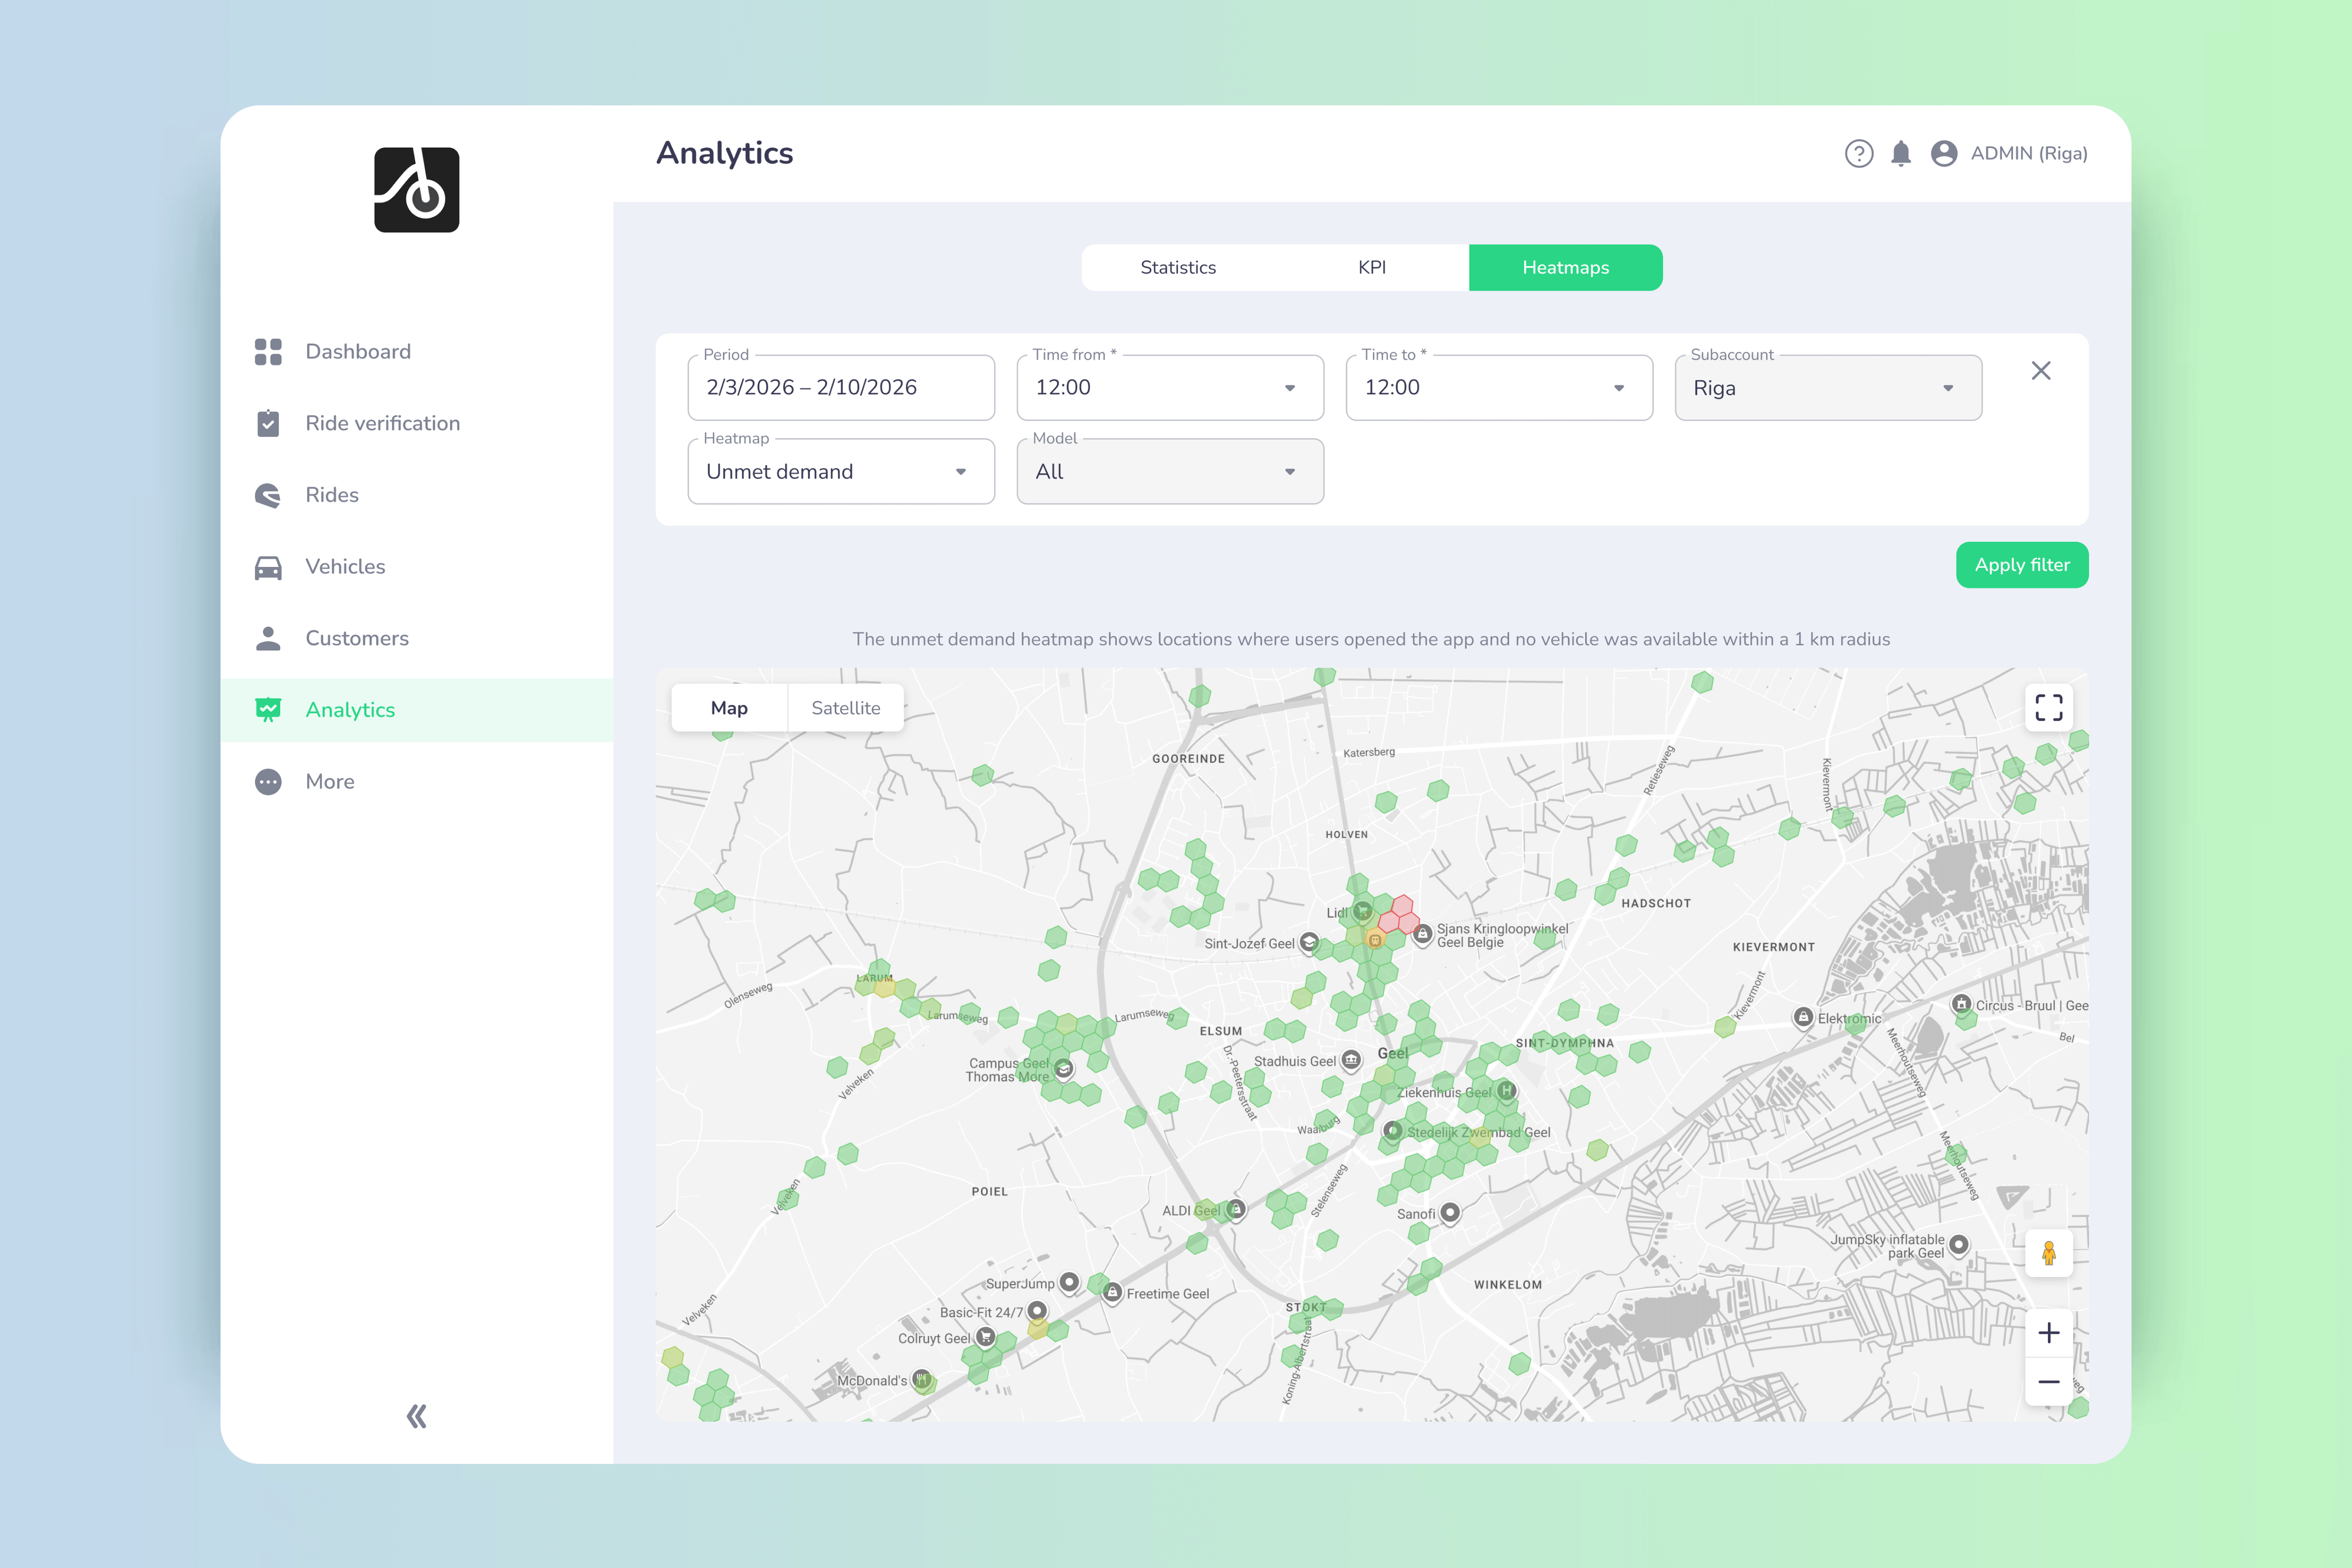
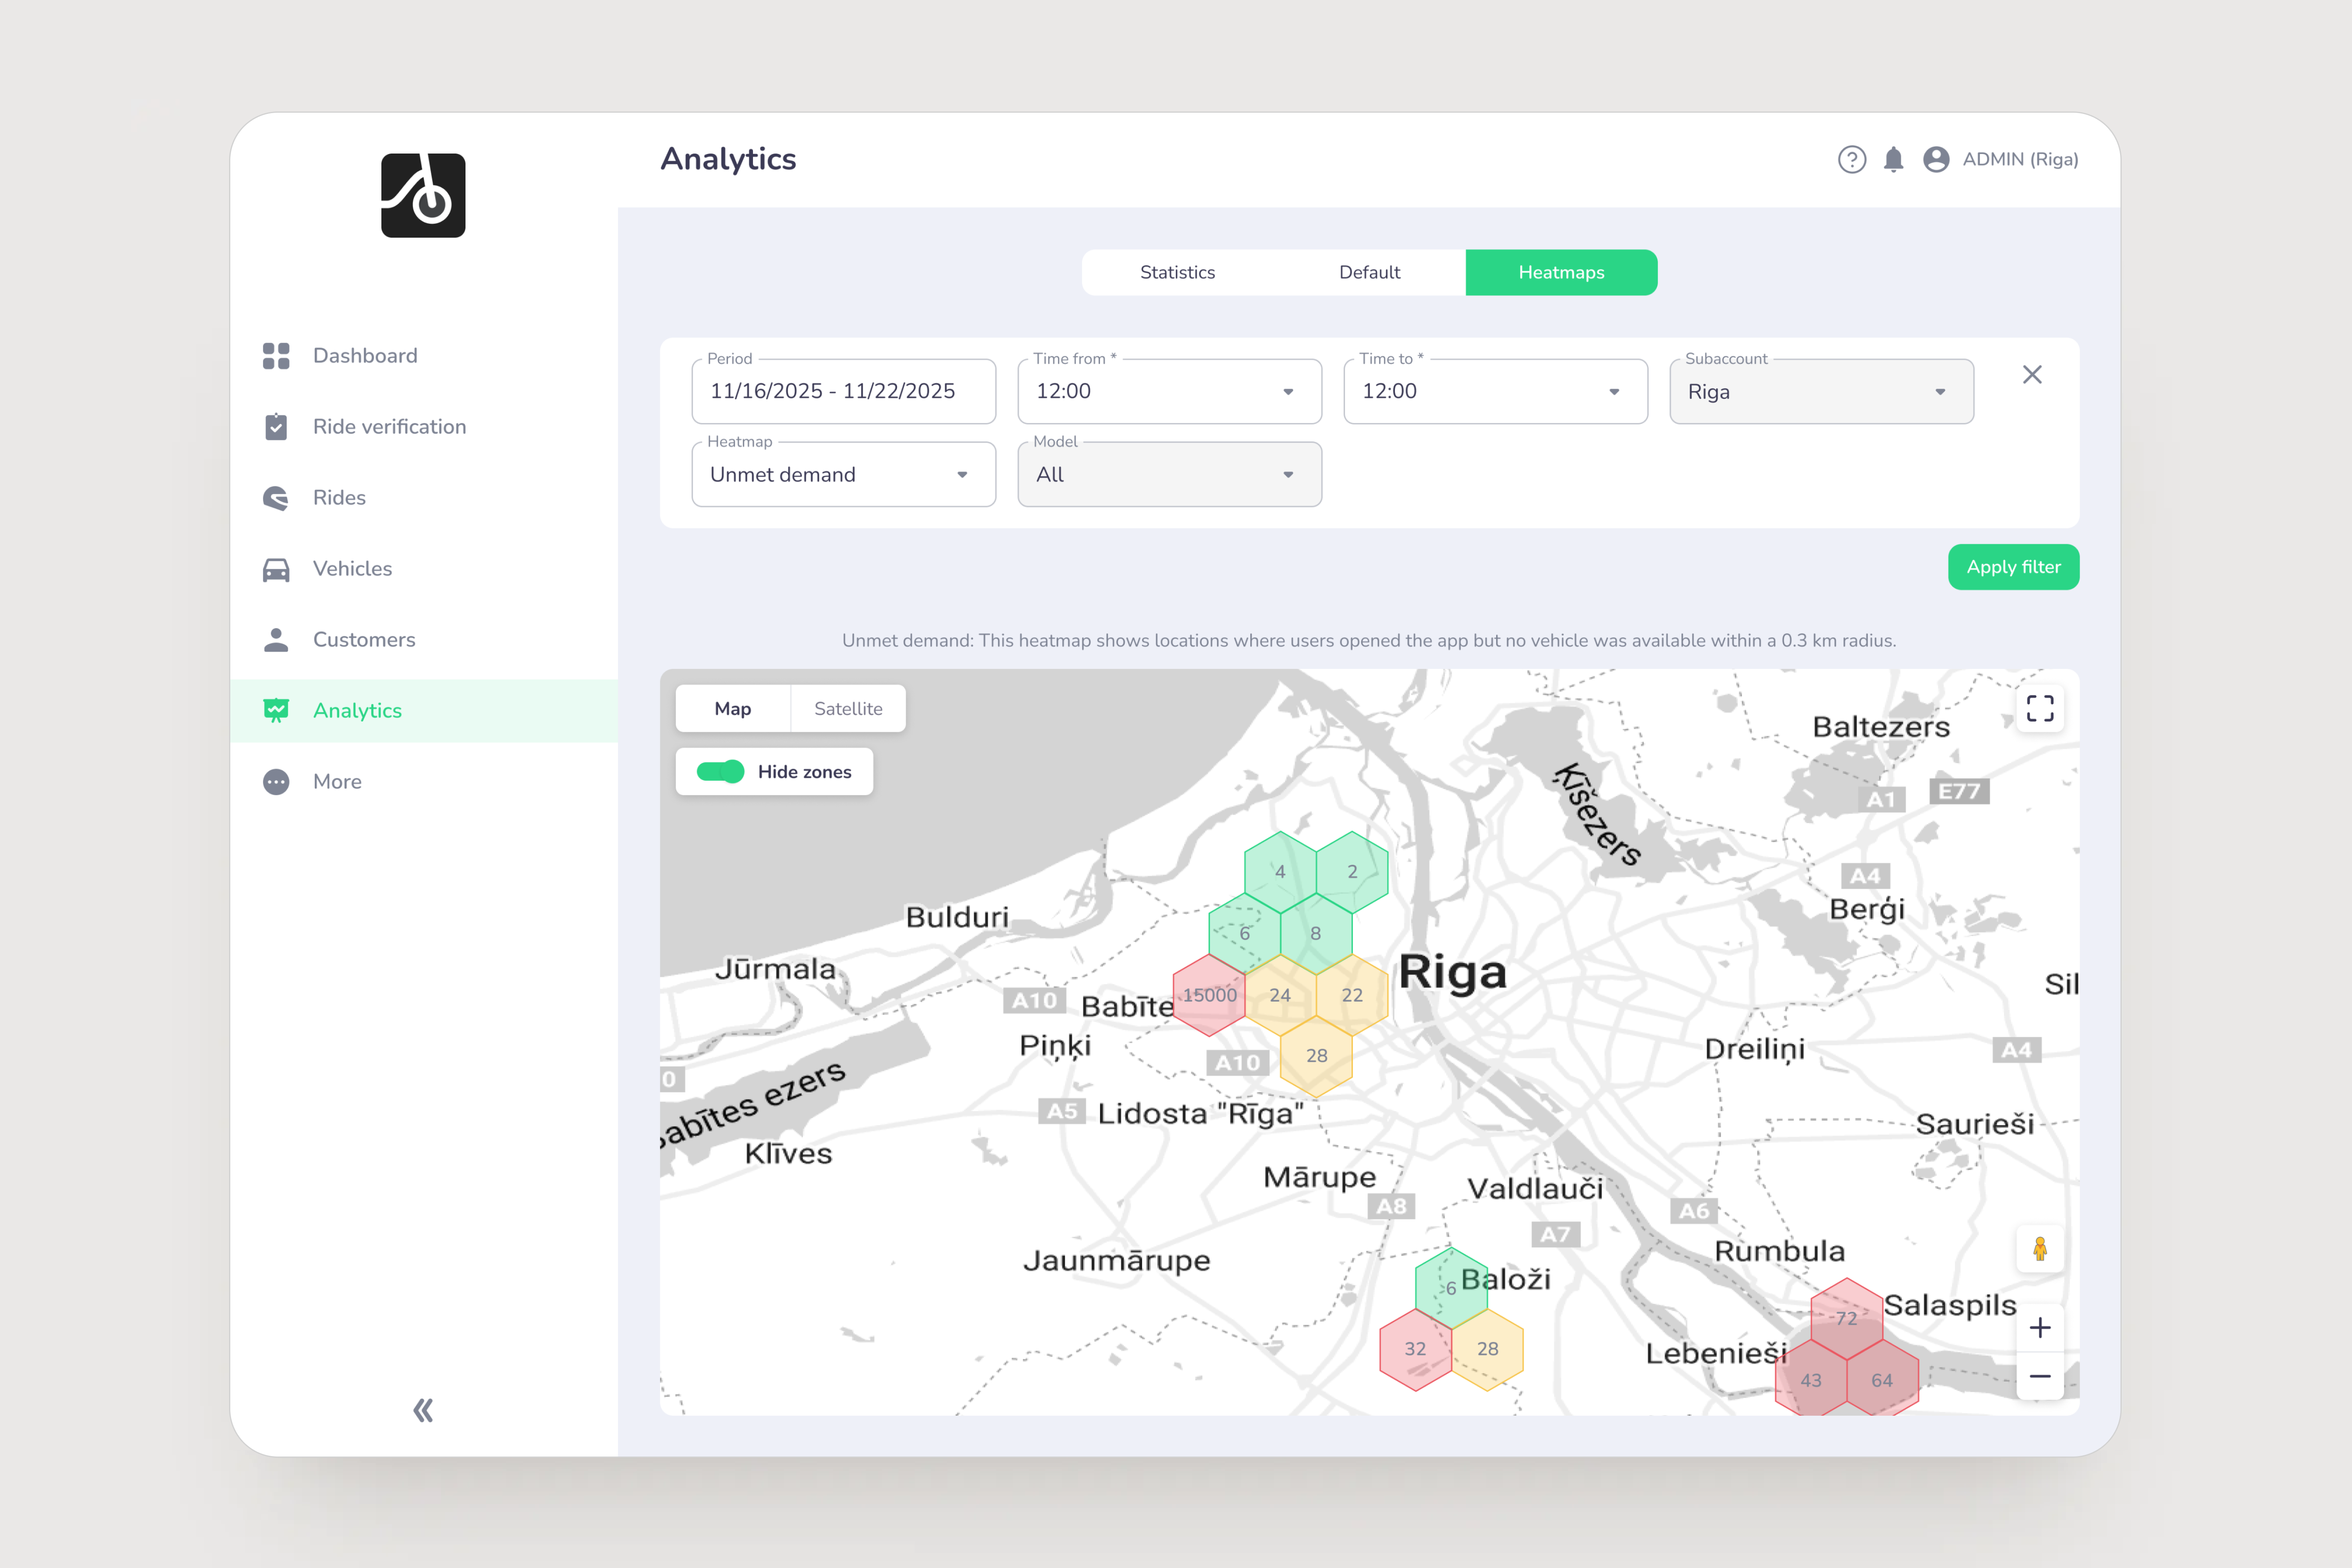
📉 Every unmet search is lost revenue. The unmet demand heatmap shows where users actively searched for vehicles but none were available - giving operators clear, search-based demand signals to rebalance fleets 🚚, improve conversions 📈, and grow smarter 🧠.
Fleet operators don’t lose revenue because of lack of demand - they lose it because demand appears in the wrong place at the wrong time. That’s exactly the problem the Unmet demand heatmap solves.
This new analytics layer from ATOM Mobility shows where users actively searched for vehicles but couldn’t find any within reach. Not guesses. Not assumptions. Real, proven demand currently left on the table.
The unmet demand heatmap highlights locations where:
In other words: high-intent users who wanted to ride, but couldn’t. Unlike generic “app open” data, unmet demand is recorded only when a real vehicle search happens, making this one of the most actionable datasets for operators.
Many analytics tools track where users open the app (ATOM Mobility provides this data too). That’s useful - but incomplete. Unmet demand answers a much stronger question:
Where did users try to ride and failed? That difference matters.
Unmet demand data is:
✅ Intent-driven (search-based, not passive)
✅ Directly tied to lost revenue
✅ Immediately actionable for rebalancing and expansion
✅ Credible for discussions with cities and partners
Here’s how the logic is implemented under the hood:
1. Search-based trigger. Unmet demand is recorded only when a user performs a vehicle search. No search = no data point.
2. Distance threshold. If no vehicle is available within 1,000 meters, unmet demand is logged.
3. Shared + private fleet support. The feature tracks unmet demand for:
This gives operators a full picture across all use cases.
4. GPS validation. Data is collected only when:
This ensures accuracy and avoids noise.
To prevent multiple searches from the same user artificially inflating demand, the system applies intelligent filtering:
- After a location is stored, a 30-minute cooldown is activated
- If the same user searches again within 30 minutes And within 100 meters of the previous location → the record is skipped
- After 30 minutes, a new record is stored - even if the location is unchanged
Result: clean, realistic demand signals, not spammy heatmaps.
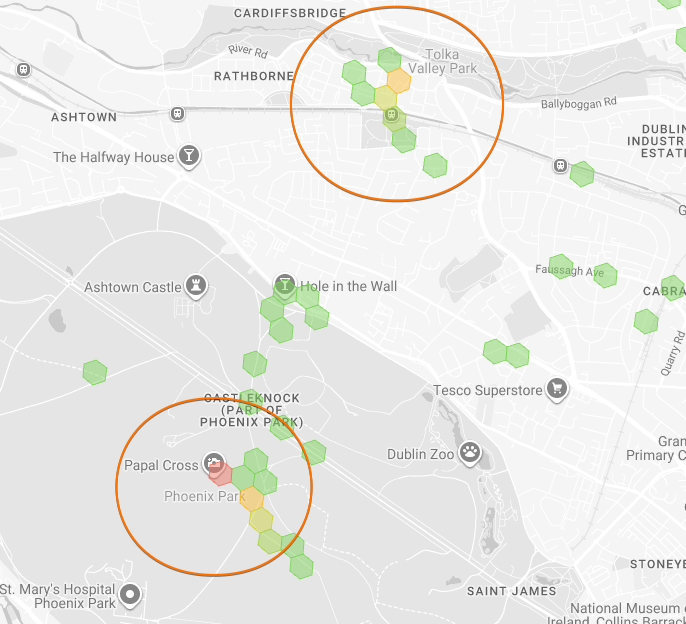
Unmet demand shows exactly where vehicles are missing allowing you to:
🚚 Smarter rebalancing
Instead of guessing where to move vehicles, teams can prioritize:
🏙 Stronger city conversations
Unmet demand heatmaps are powerful evidence for:
📊 Higher conversion rates
Placing vehicles where users actually search improves:
The new unmet demand heatmap is designed to work alongside other analytics layers, including:
- Popular routes heatmap
- Open app heatmap
- Start & end locations heatmap
Operators can also:
Every unmet search is a signal. Every signal is a potential ride. Every ride is revenue. With the unmet demand heatmap, operators stop guessing and start placing vehicles exactly where demand already exists.
👉 If you want to see how unmet demand can unlock growth for your fleet, book a demo with ATOM Mobility and explore how advanced heatmaps turn data into decisions.
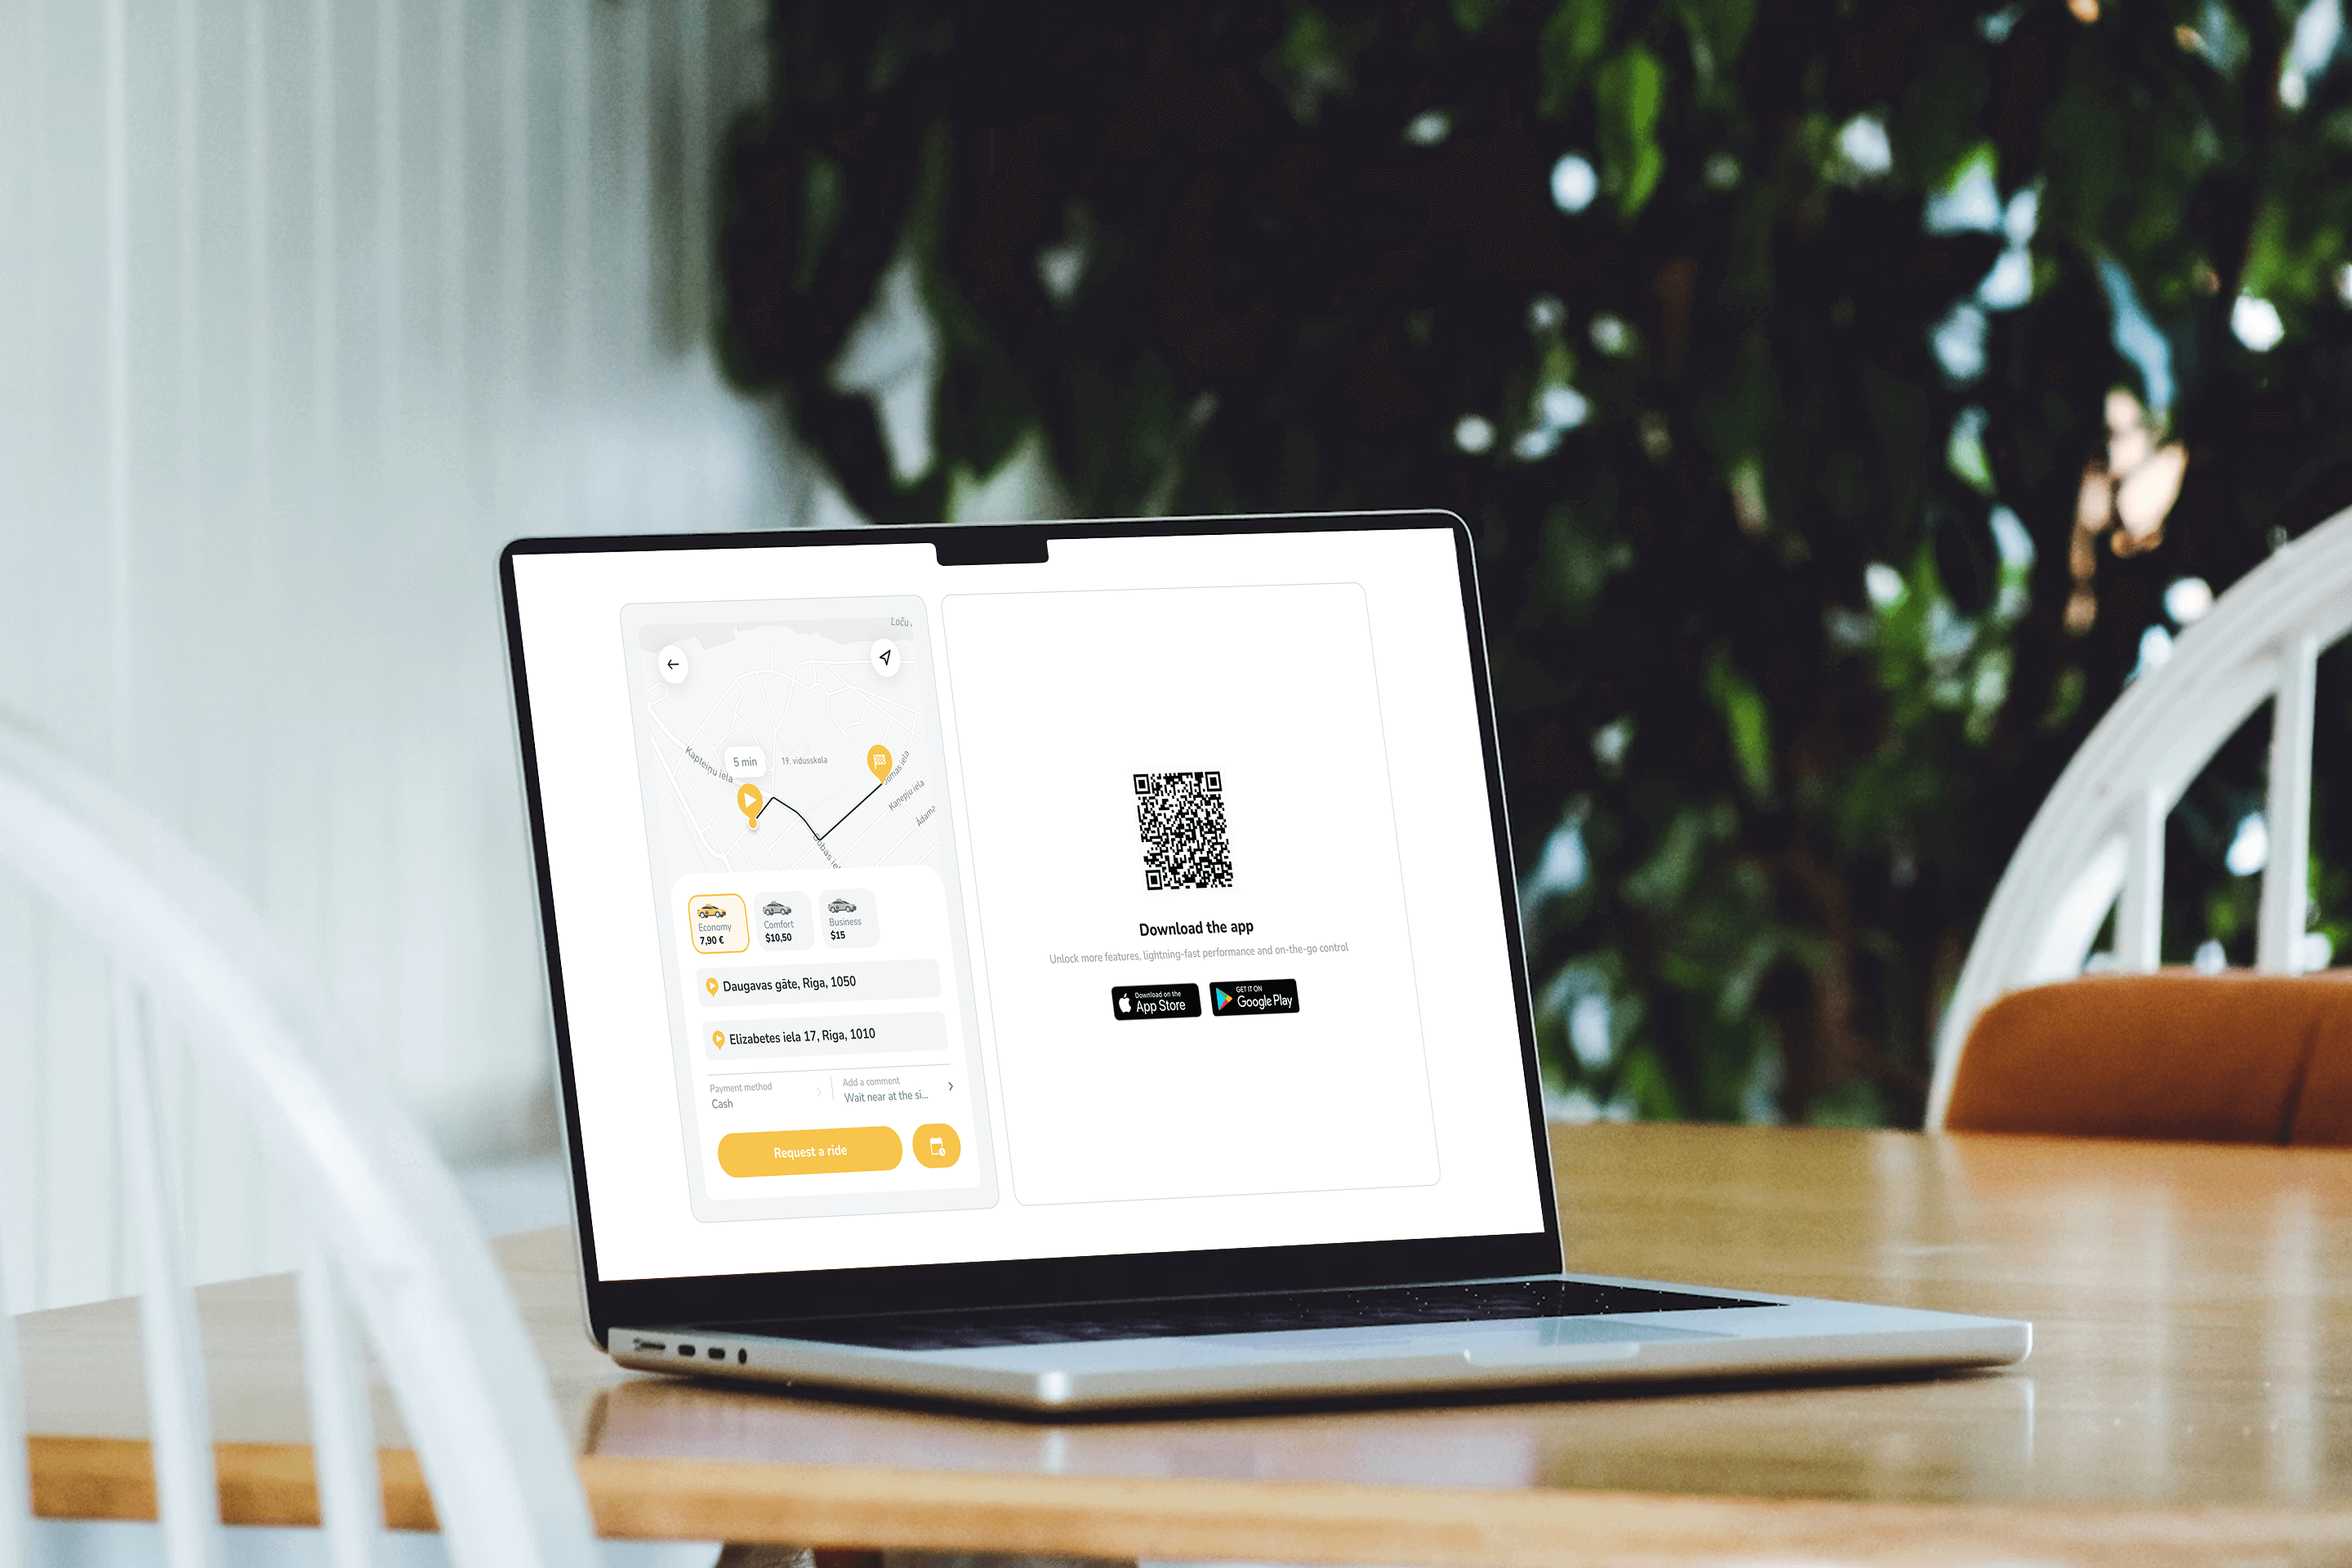
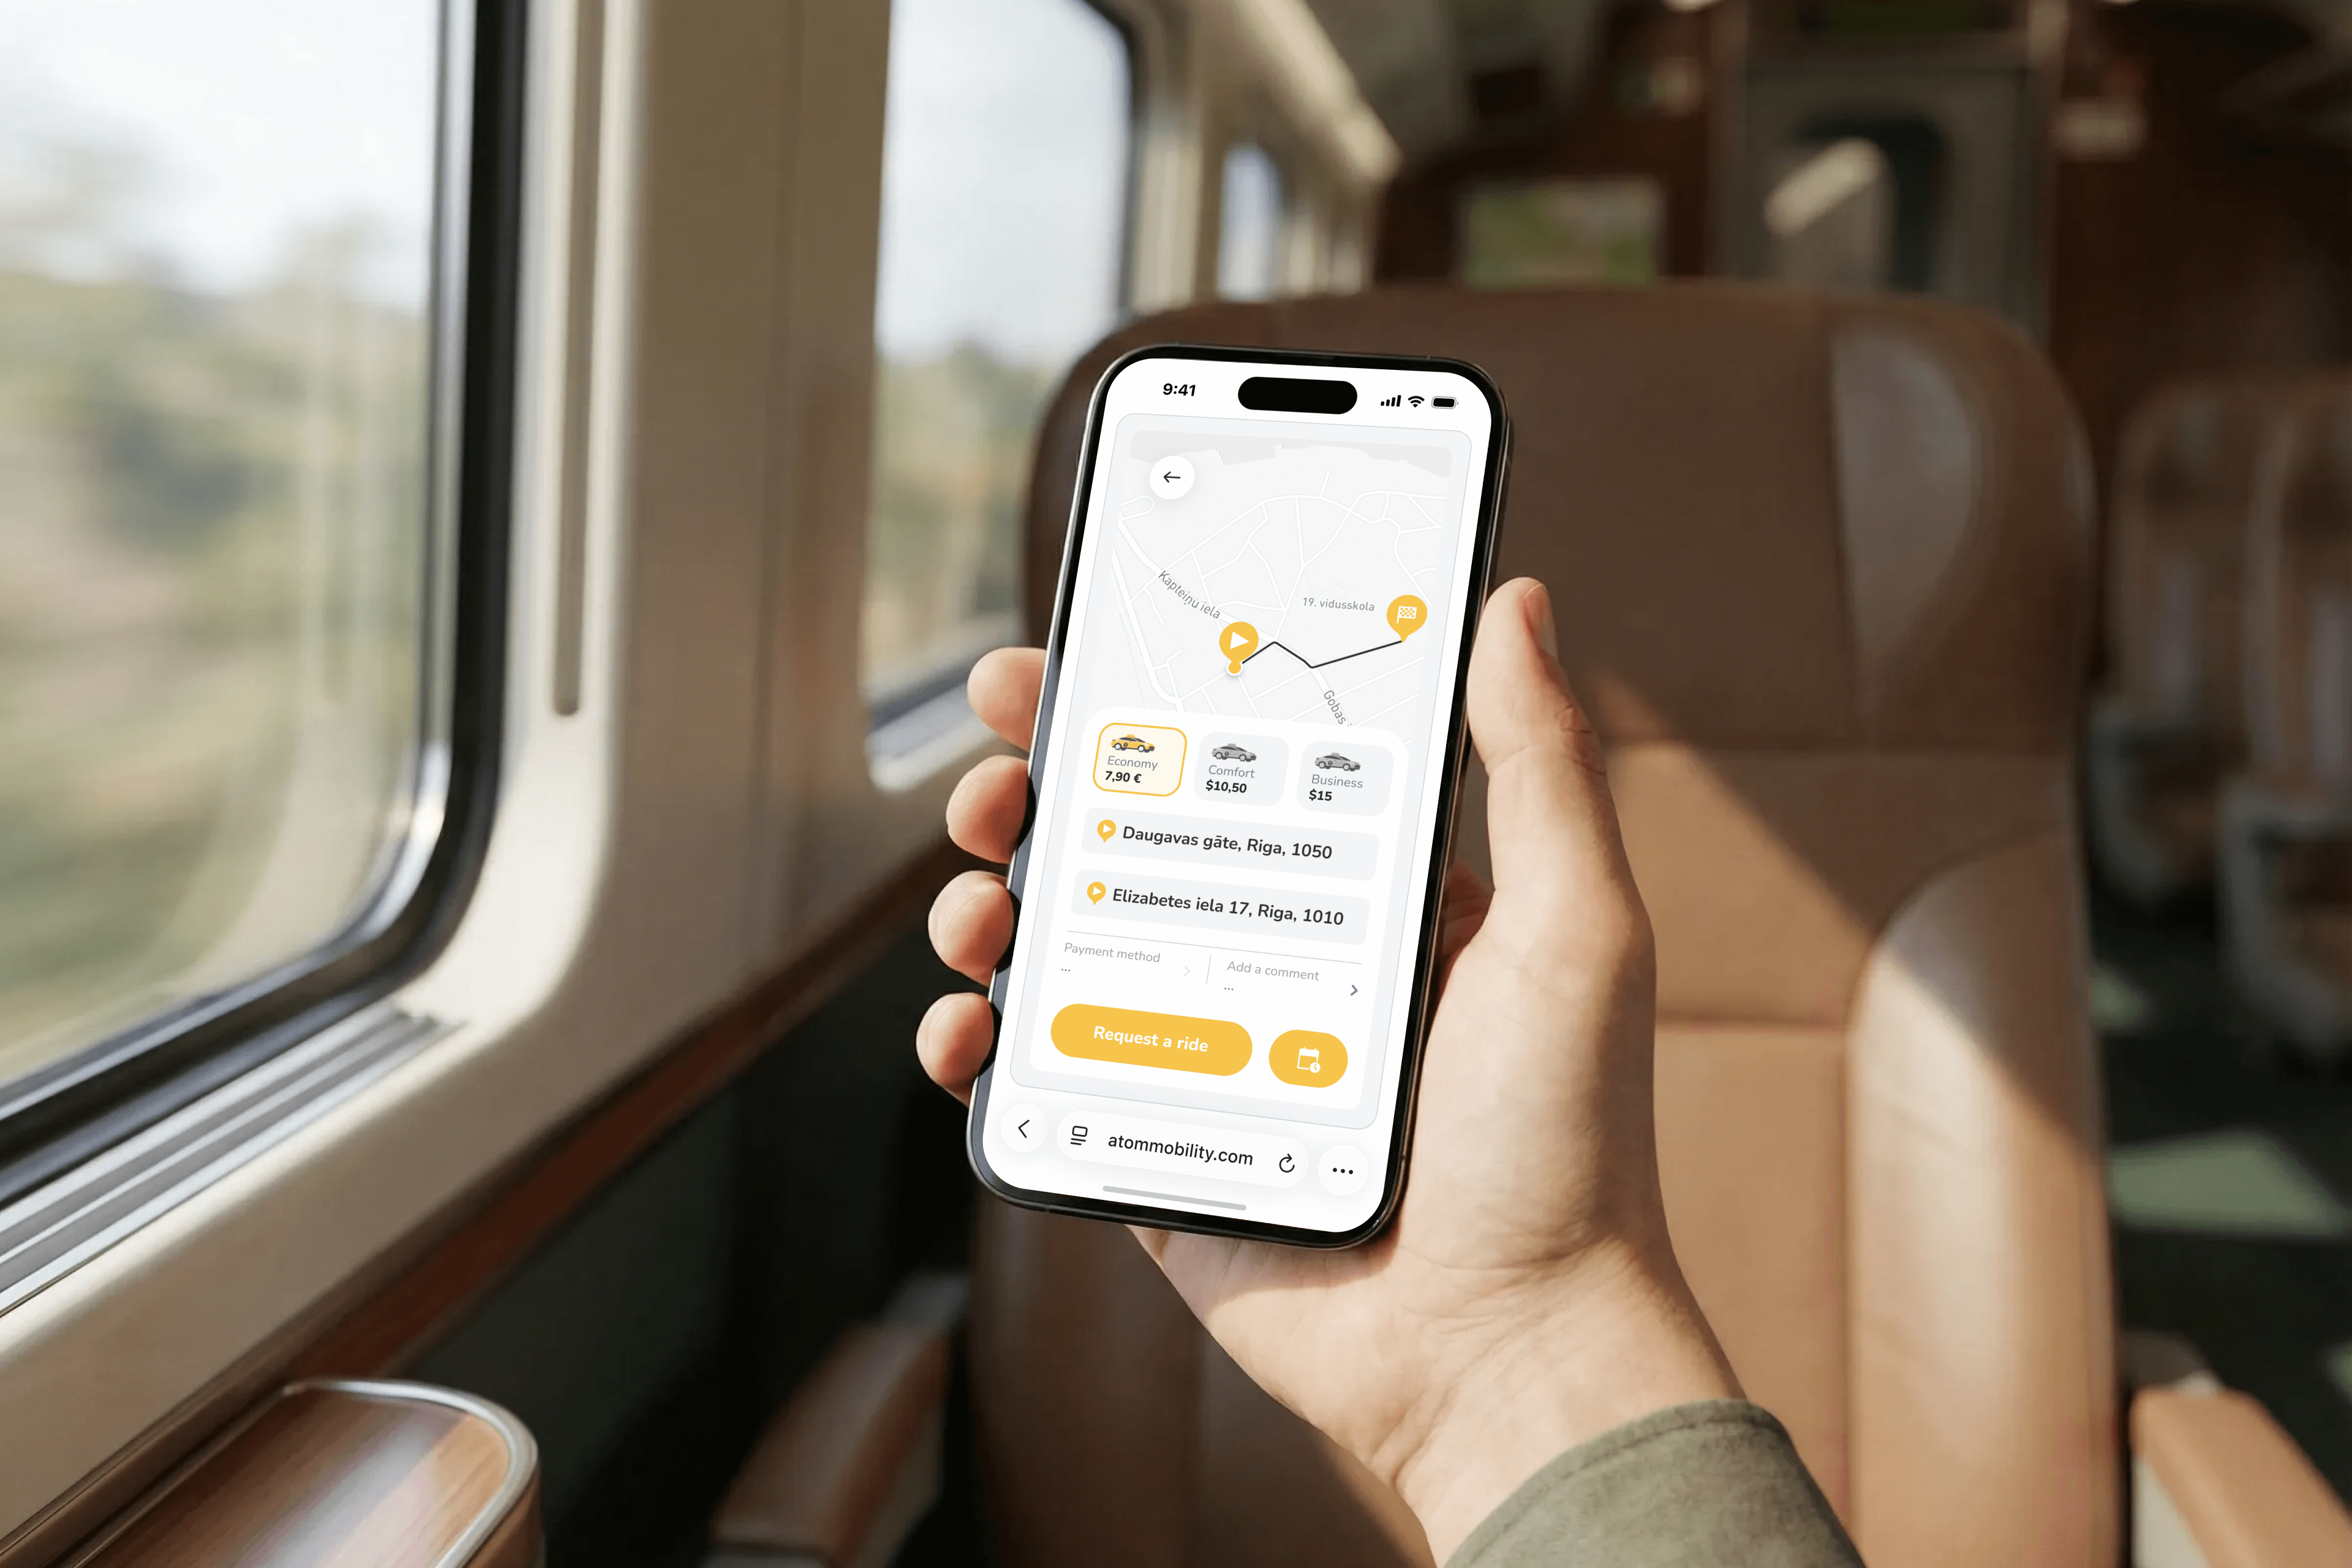
🚕 Web-booker is a lightweight ride-hail widget that lets users book rides directly from a website or mobile browser - no app install required. It reduces booking friction, supports hotel and partner demand, and keeps every ride fully synced with the taxi operator’s app and dashboard.
What if ordering a taxi was as easy as booking a room or clicking “Reserve table” on a website?
Meet Web-booker - a lightweight ride-hail booking widget that lets users request a cab directly from a website, without installing or opening the mobile app.
Perfect for hotels, business centers, event venues, airports, and corporate partners.
👉 Live demo: https://app.atommobility.com/taxi-widget
Web-booker is a browser-based ride-hail widget that operators can embed or link to from any website.
The booking happens on the web, but the ride is fully synchronized with the mobile app and operator dashboard.
No redirects. No app-store friction. No lost users.
This keeps fraud low while preserving conversion.
Web-booker addresses one of the most common friction points in ride-hailing: users who need a ride now but are not willing to download an app first. By allowing bookings directly from a website, operators can capture high-intent demand at the exact moment it occurs - whether that is on a hotel website, an event page, or a partner landing page.
At the same time, Web-booker makes partnerships with hotels and venues significantly easier. Instead of complex integrations or manual ordering flows, partners can simply place a button or link and immediately enable ride ordering for their guests. Importantly, this approach does not block long-term app growth. The booking flow still promotes the mobile app through QR codes and store links, allowing operators to convert web users into app users over time - without forcing the install upfront.
Web-booker is not designed to replace the mobile app. It extends the acquisition funnel by adding a low-friction entry point, while keeping all bookings fully synchronized with the operator’s app and dashboard.
👉 Try the demo
https://app.atommobility.com/taxi-widget
Want to explore a ride-hail or taxi solution for your business - or migrate to a more flexible platform? Visit: https://www.atommobility.com/products/ride-hailing
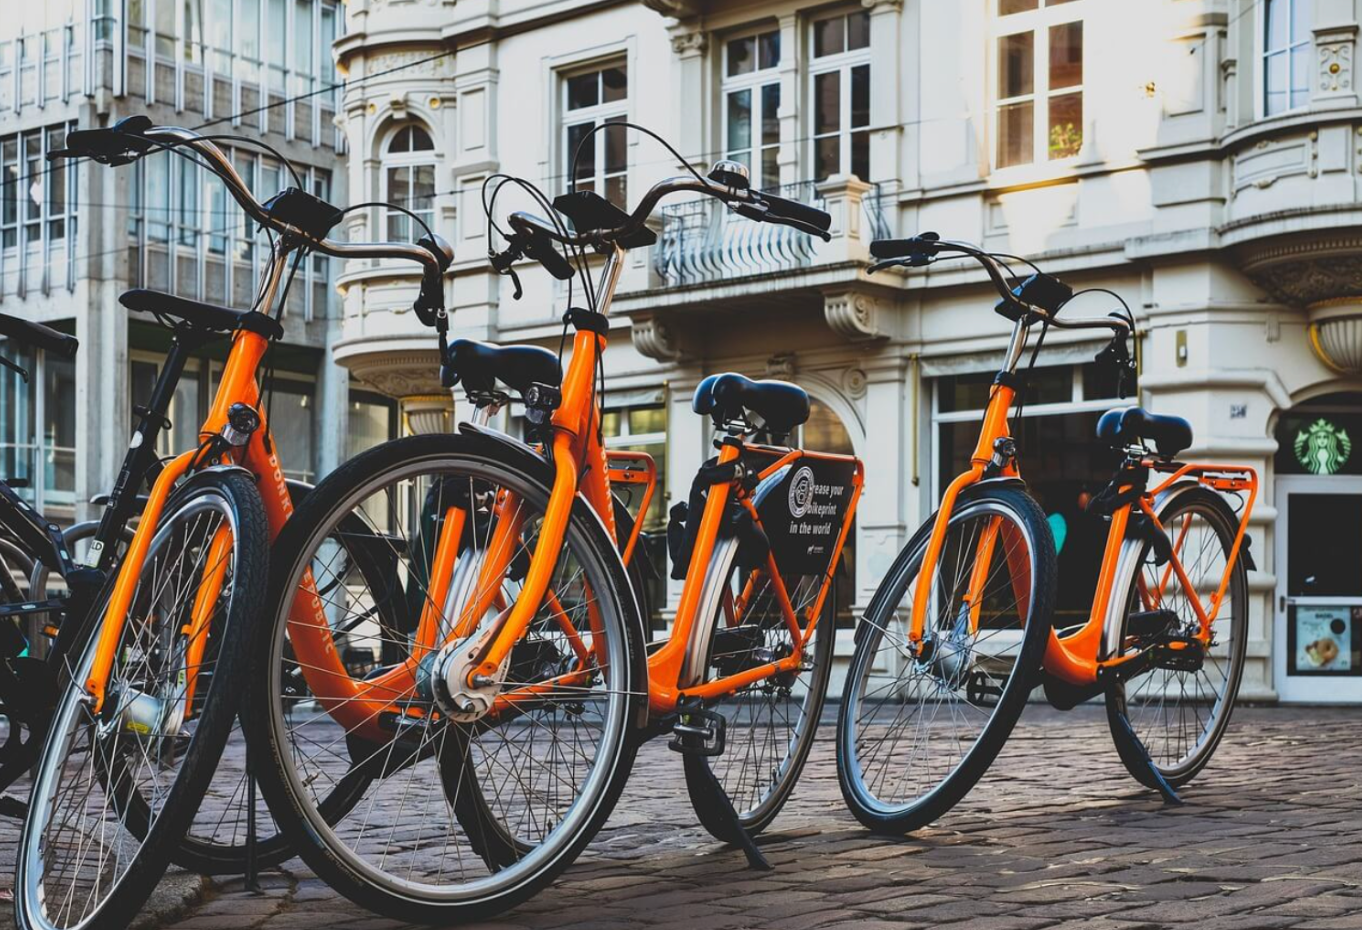
🚲 Cleaner air, less traffic, and better city living - bike-sharing apps are making it happen. With seamless apps, smart integration, and the right infrastructure, shared bikes are becoming a real alternative to cars in cities across Europe.💡 See how bike-sharing supports sustainable mobility and what cities and operators can do to get it right.
Bike-sharing apps are reshaping urban mobility. What began as a practical way to get around without owning a bike is now part of a bigger shift toward sustainable transport.
These services are doing more than replacing short car trips. They help cities cut emissions, reduce congestion, improve health, and connect better with public transport.
As more cities rethink how people move, bike sharing continues to grow as one of the fastest and most affordable tools to support this change.
Bike-sharing services now operate in over 150 European cities, with more than 438,000 bikes in circulation. These systems help prevent around 46,000 tonnes of CO₂ emissions annually and reduce reliance on private cars in dense urban areas. They also improve air quality, lower noise levels, and make cities more pleasant to live in.
A recent study by EIT Urban Mobility and Cycling Industries Europe, carried out by EY, found that bike-sharing services generate around €305 million in annual benefits across Europe. This includes reduced emissions, lower healthcare costs, time saved from less congestion, and broader access to jobs and services.
For cities, the numbers speak for themselves: every euro invested yields a 10% annual return, generating €1.10 in positive externalities. By 2030, these benefits could triple to €1 billion if bike-sharing is prioritized.
Bike sharing works best when it fits into the wider transport system. Most car trips that bike sharing replaces are short and often happen when public transport doesn’t quite reach the destination. That last kilometer between a bus stop and your home or office can be enough to make people choose the car instead.
Placing shared bikes near metro stations, tram stops, or bus terminals makes it easier for people to leave their cars behind. This “last-mile” connection helps more people use public transport for the long part of their trip and hop on a bike for the short part. Over time, that encourages more consistent use of both bikes and transit.
In cities where bike sharing is integrated into travel passes or mobility platforms, users can combine modes in a single journey. That flexibility supports wider access and makes shared bikes part of everyday mobility, not just something used occasionally.
The digital experience behind bike sharing is a big part of why it works. People can check availability, unlock a bike, pay, and end their trip – all in one app. This makes it quick, simple, and consistent.
Good bike-sharing apps also offer:
When users don’t need to think twice about how the system works, they’re more likely to build regular habits around it. That habit shift is what makes a long-term difference for both users and cities.
Bike sharing isn’t just a transport service. It helps cities meet public goals – cleaner air, lower traffic, healthier residents, and better access to services. When someone chooses a bike instead of a car, it reduces the demand for fuel, parking, and space on the road.
The €305 million annual benefit includes health savings due to increased physical activity, avoided emissions, time gained from reduced congestion, and the creation of jobs tied to fleet operations. Many bike-sharing schemes also improve equity by giving people access to mobility in areas that are underserved by public transport or where car ownership isn’t affordable.
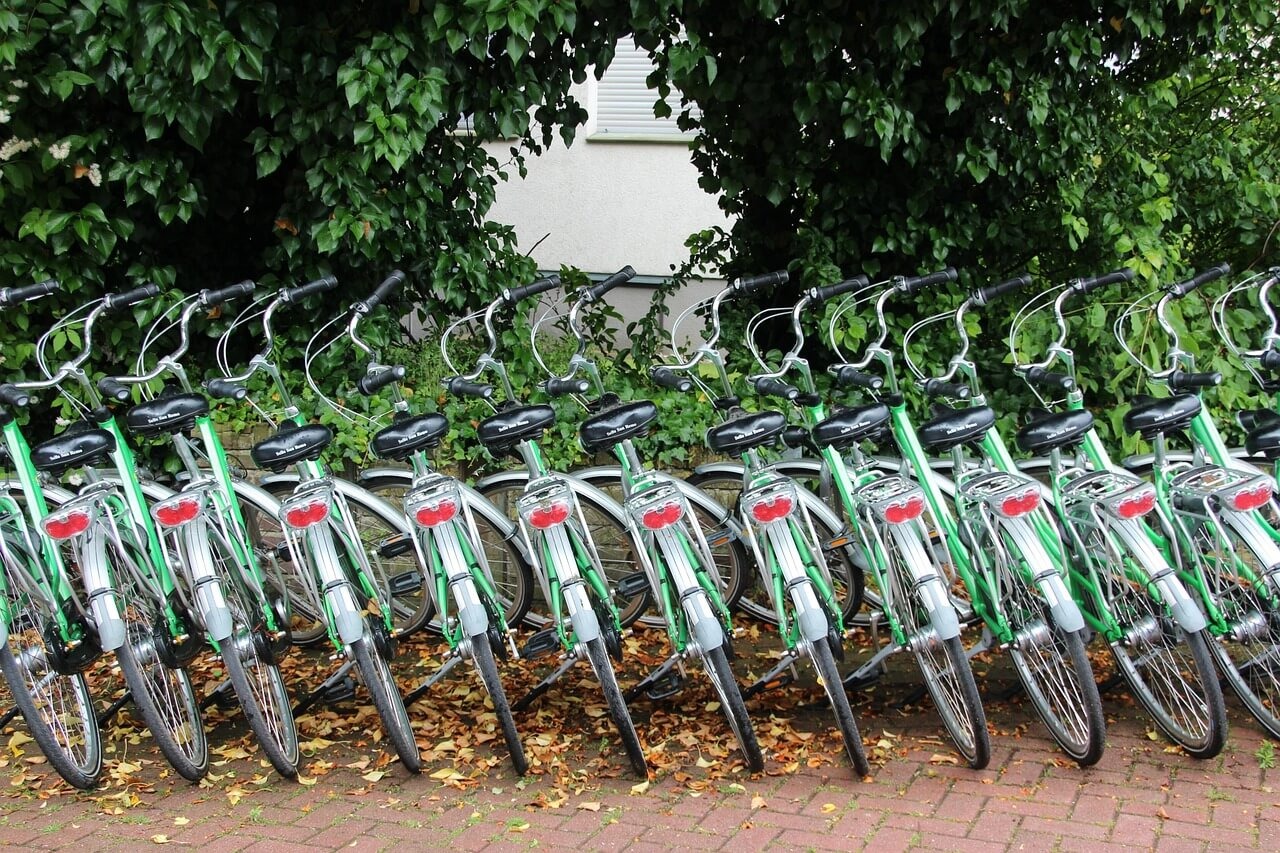
Shared bikes are especially useful in mid-sized cities where distances are manageable and car traffic still dominates. With the right policy support, even small fleets can have a noticeable impact on mobility patterns and public health.
Not every bike-sharing system succeeds. To be reliable and scalable, a few things must work together:
Successful systems often grow in partnership with city governments, public transport agencies, and private operators who bring technology, logistics, and know-how.
Reliable software is what keeps all parts of the system connected. From unlocking a bike to seeing usage trends across the city, operators need tools that are stable, flexible, and easy to manage. For those launching or scaling a fleet, platforms like ATOM Mobility offer ready-made solutions that handle booking, payments, ID checks, live tracking, and fleet control in one place.
The platform supports both electric and mechanical bikes, offers branded apps, and integrates with smart locks or IoT modules for remote vehicle access. It also lets operators adjust pricing, monitor vehicle health, and manage customer support in real time. That means smaller teams can launch faster and scale smarter, without having to build every tool from scratch.
Bike sharing won’t replace all car trips, but even a small shift makes a difference. A few short rides per week can reduce emissions, improve fitness, and save time spent in traffic. When these trips are supported by good infrastructure, public awareness, and seamless apps, the impact grows.
As cities continue to prioritise sustainability, shared micromobility will play a bigger role in helping people move in cleaner, healthier, and more flexible ways. With the right technology and planning, bike sharing becomes more than a service – it becomes a habit that supports better cities for everyone.
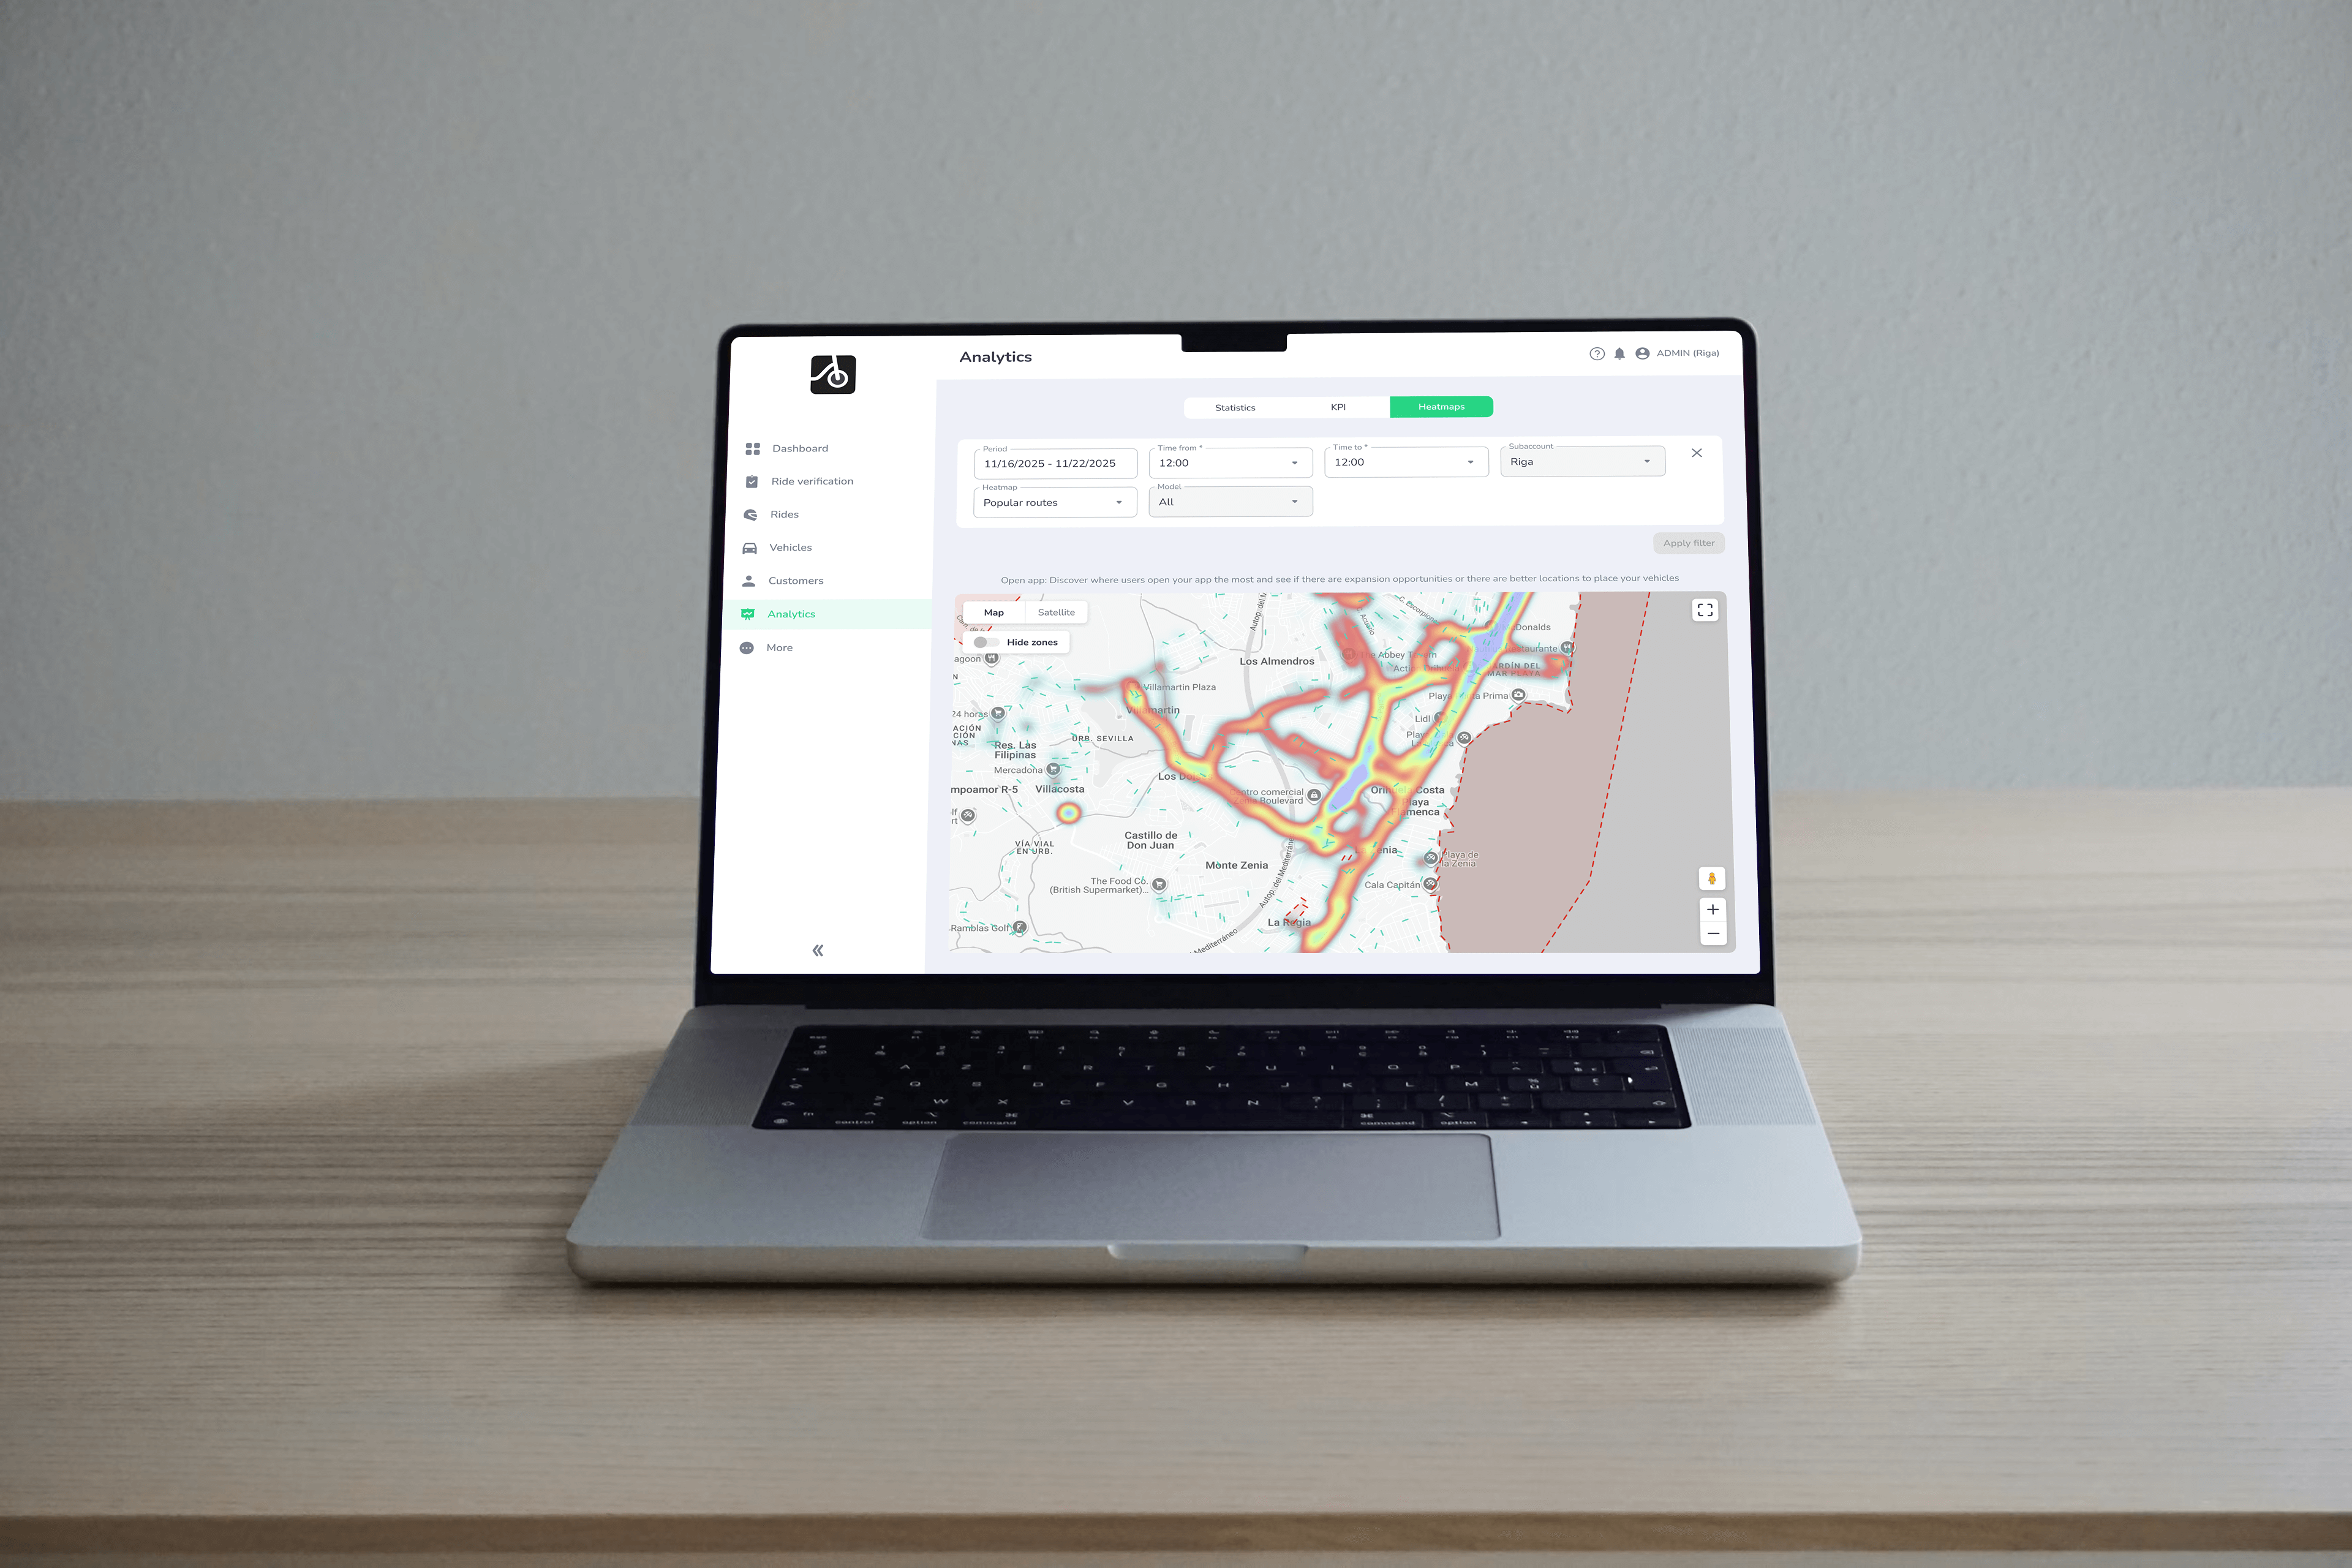
📊 One of the most requested features in ATOM Mobility is finally live. Meet Popular route heatmap - a new analytics layer that shows which streets and areas your riders actually use most, based on real ride data over time.
📊 One of the most requested features in ATOM Mobility is finally live. Meet Popular route heatmap - a new analytics layer that shows which streets and areas your riders actually use most, based on real ride data over time.
Until now, operators could see where rides start and end. Now you can see how people move in between.
Why it matters?
With Popular Route Heatmap, operators can:
🚲 Optimize vehicle placement based on real rider behavior
🏙️ Support discussions with municipalities using clear, visual usage data
📍 Identify missing infrastructure where demand already exists
📊 Make smarter, data-backed operational decisions
The feature was the #1 most upvoted idea on our merchant suggestion platform for years - and we’re excited to finally ship it.
.png)
How to use it
Go to Analytics → Heatmaps
Select heatmap type Popular routes
Filter by time period and city
Zoom in to see the busiest routes your riders take
Data availability: Popular route data is available from November 1, 2025 and will continue accumulating going forward.
Inspired by how athletes analyze movement patterns with Strava - now applied to shared mobility operations.

"State of art technology in mobile apps and dashboard, very good SLA!"
"Easy, nice looking, continuously updated and developed every month and most of all very reliable with a extreme high uptime"
"We used to work with a different service provider which wasn't fitting our needs. Switching to ATOM was an improvement on our side"
Driver App demo credentials - Email: test@atom.com, Password: driver

