Blog
Insights and news from the ATOM Mobility team
We started our blog to share free valuable information about the mobility industry: inspirational stories, financial analysis, marketing ideas, practical tips, new feature announcements and more.

We started our blog to share free valuable information about the mobility industry: inspirational stories, financial analysis, marketing ideas, practical tips, new feature announcements and more.
🚀 ATOM Mobility ships 7-15 new features every month, alongside smaller improvements and fixes. Explore five recent highlights: unmet demand heatmaps, automated fleet tasks, field-team performance tracking, new subscription types, and lock-screen ride updates - helping operators run more efficient fleets and improve the rider experience.
Knowing where customers need vehicles, keeping field teams productive, and giving riders reasons to return are everyday priorities for mobility operators. Every month, ATOM Mobility ships 7-15 new features, alongside smaller improvements and fixes. Here are five highlights from our recent releases - and how they can help operators improve fleet performance and the customer experience.
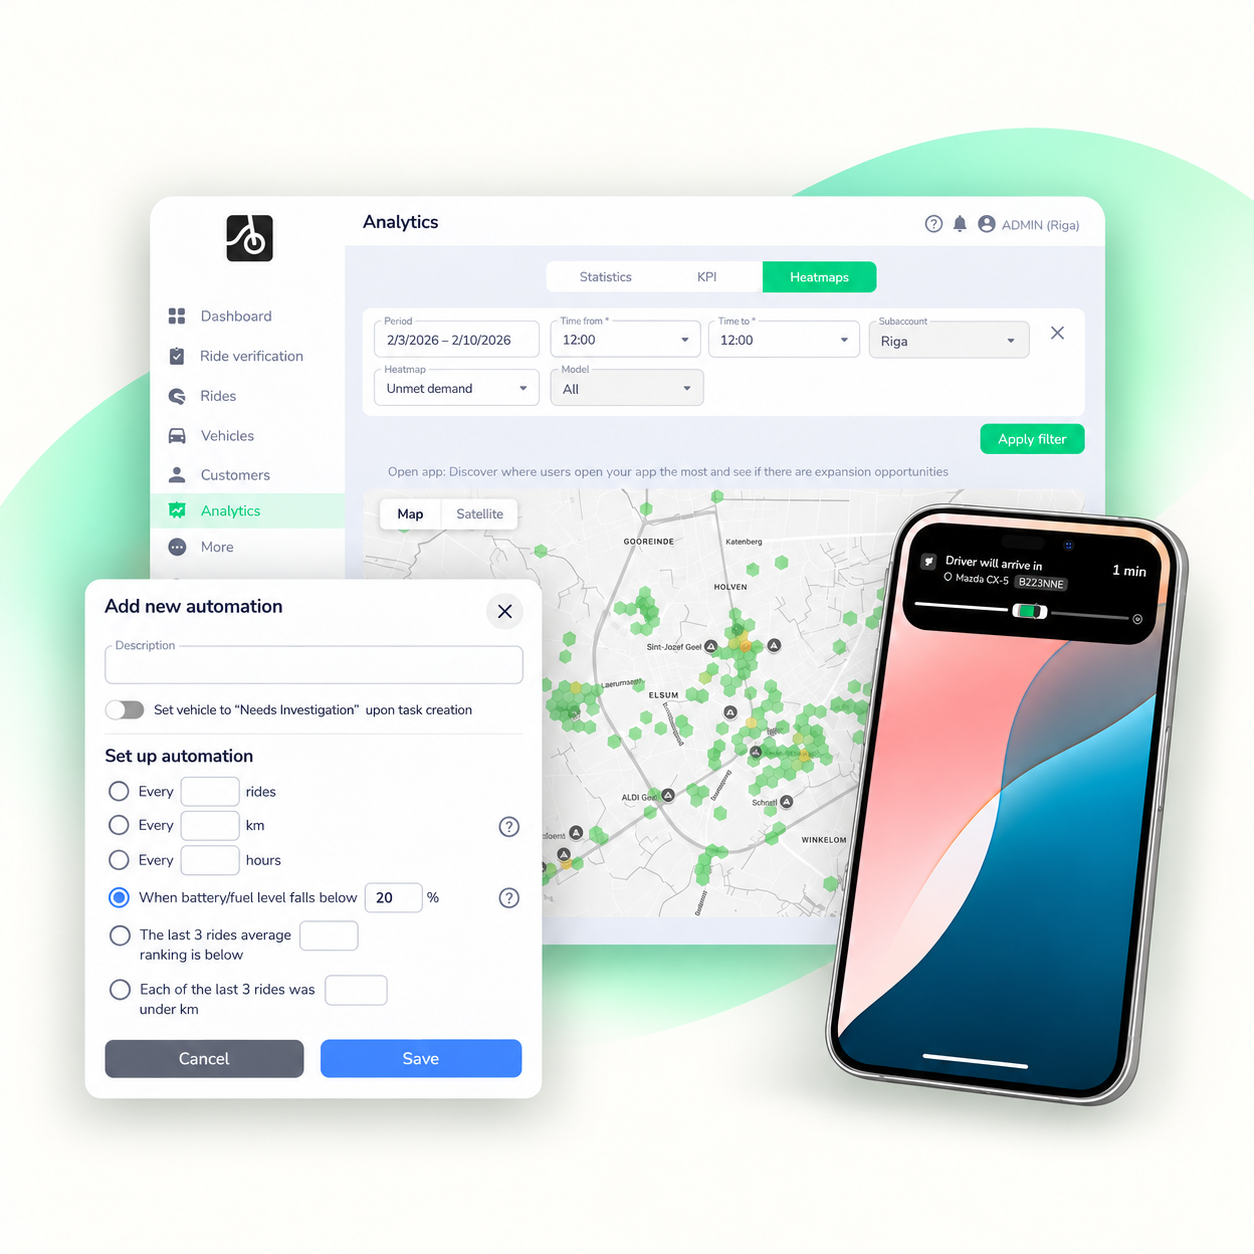
A customer opens your app, finds no vehicle nearby, and leaves. Your ride history alone won’t show you that missed opportunity.
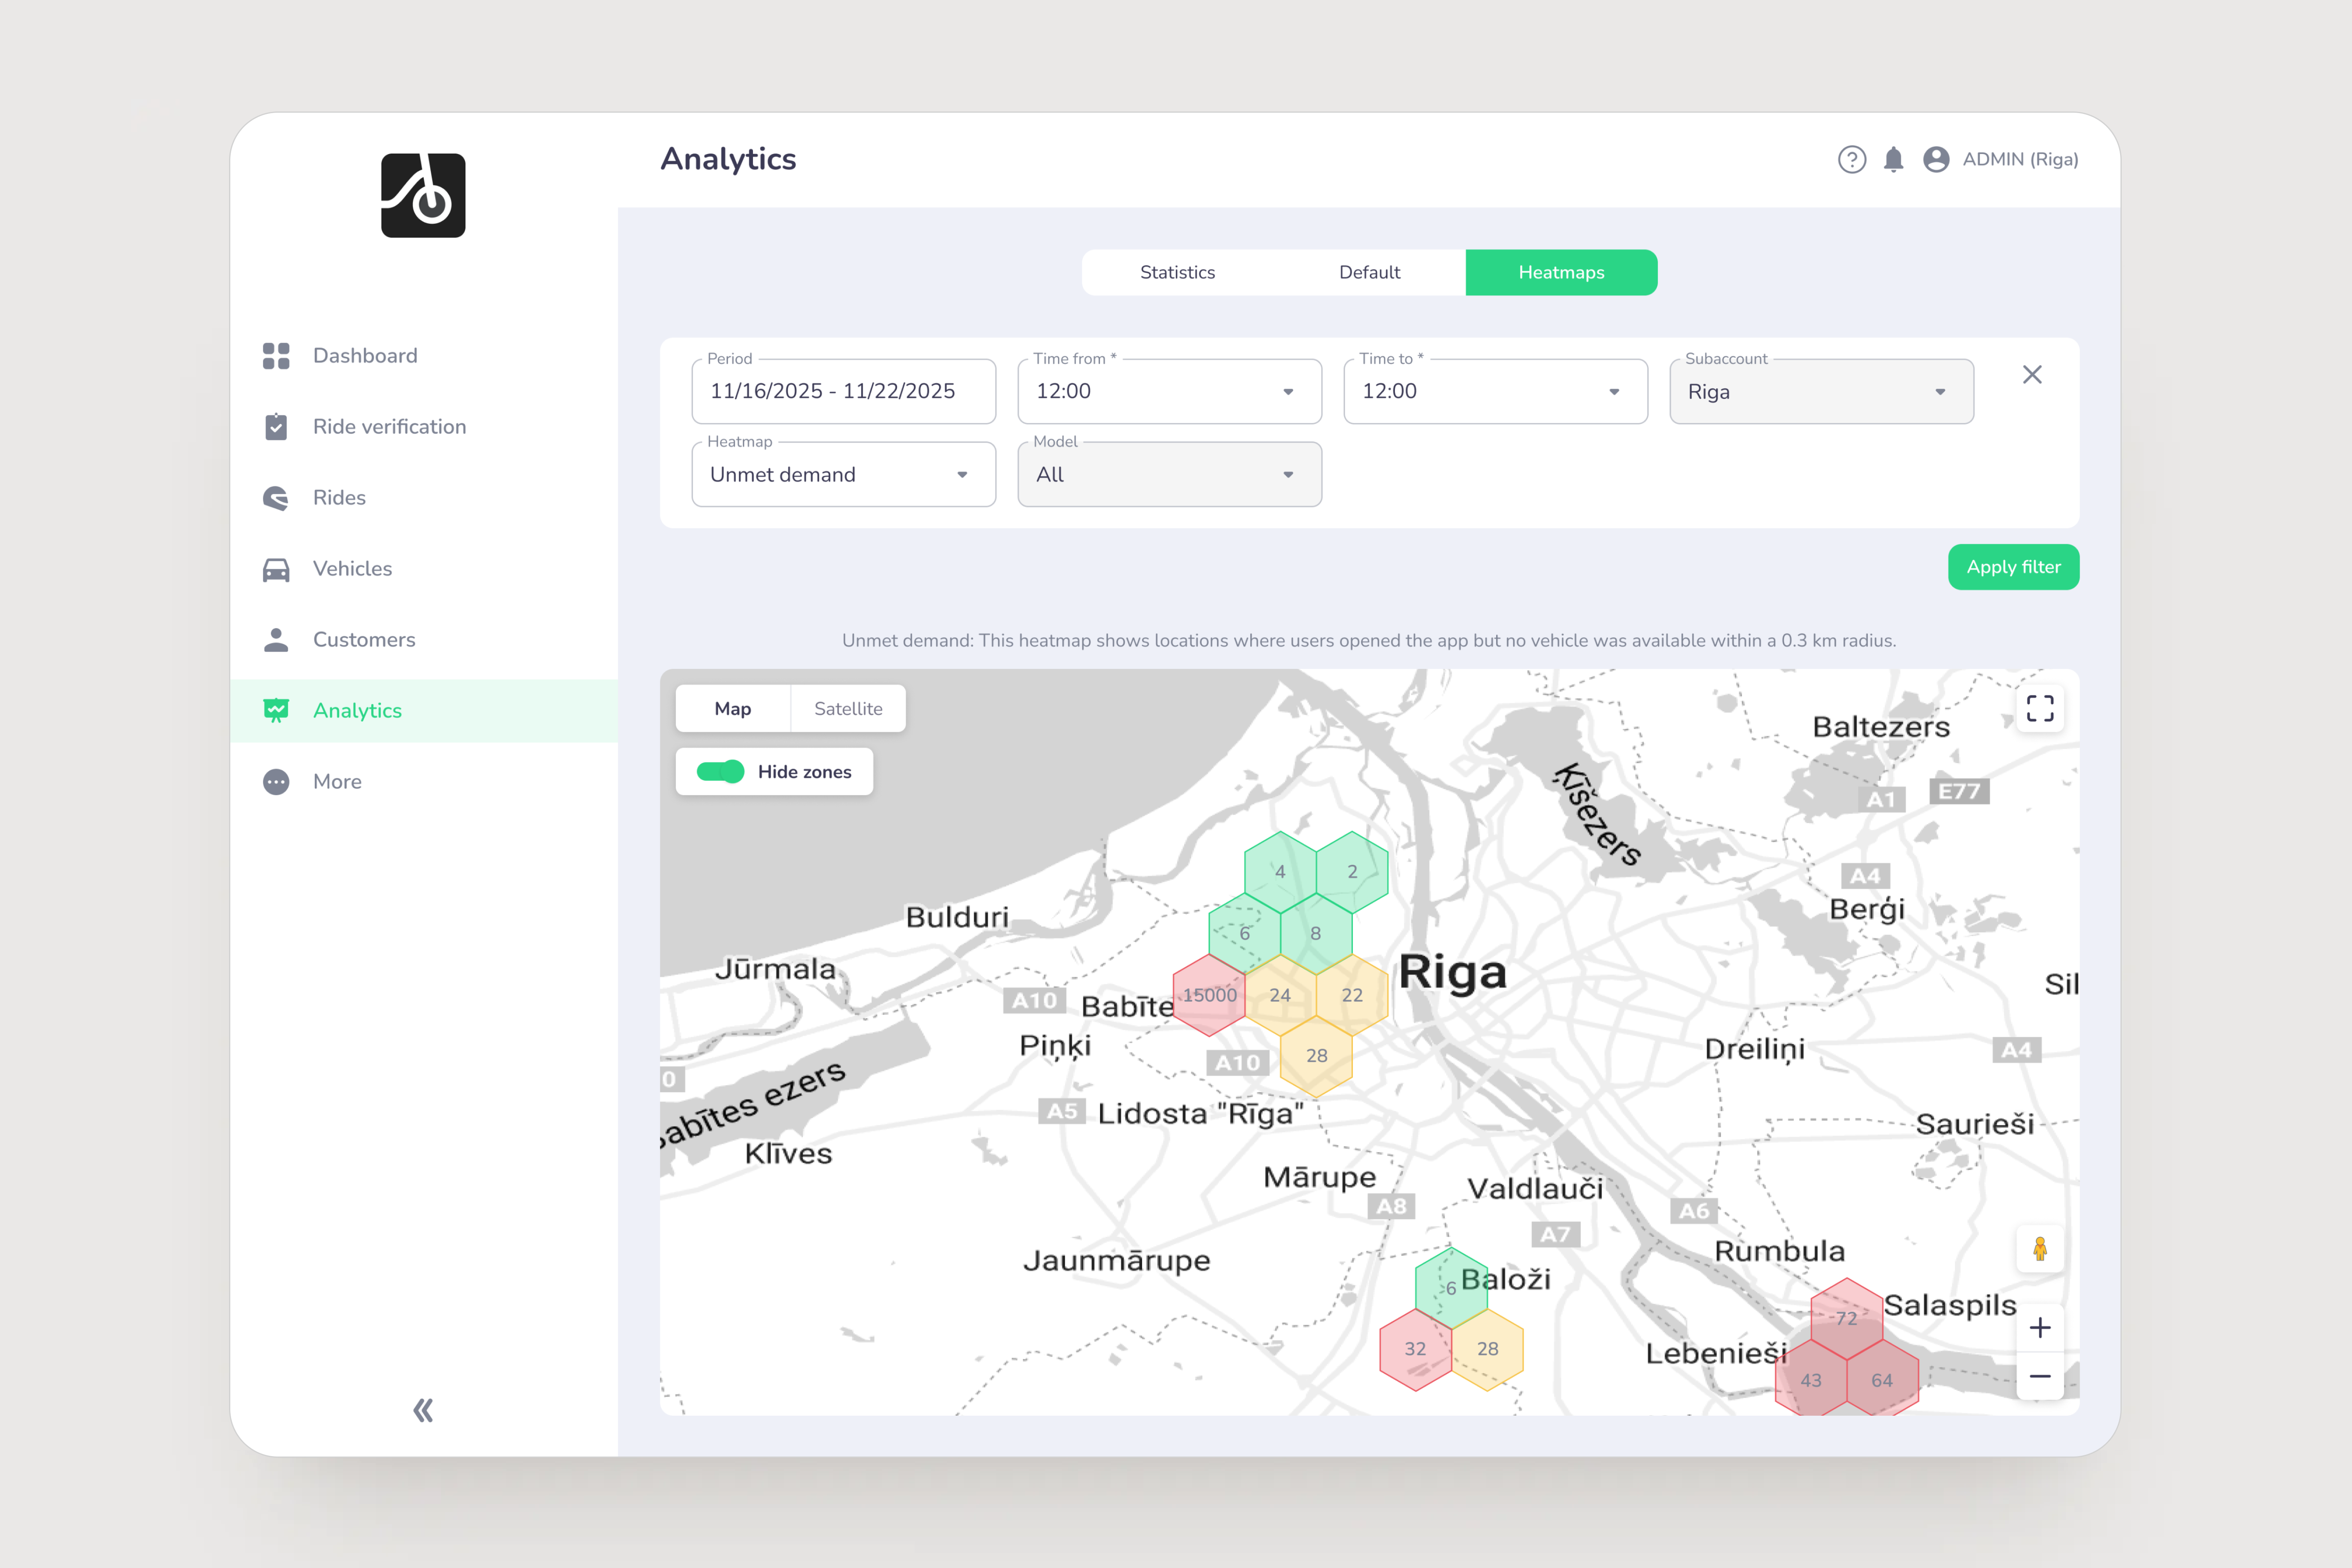
The Unmet Demand heatmap highlights areas where users open the app but cannot find an available scooter, bike, or car within 1000 metres radius. Beyond colour-coded hexagons, on zoomed in view it shows the number of unique users who searched for a vehicle in each area without finding one nearby.
Use these insights to identify gaps in fleet coverage, prioritise rebalancing, and assess potential parking locations. Alongside seeing where rides happen, you can now understand where potential demand goes unmet.

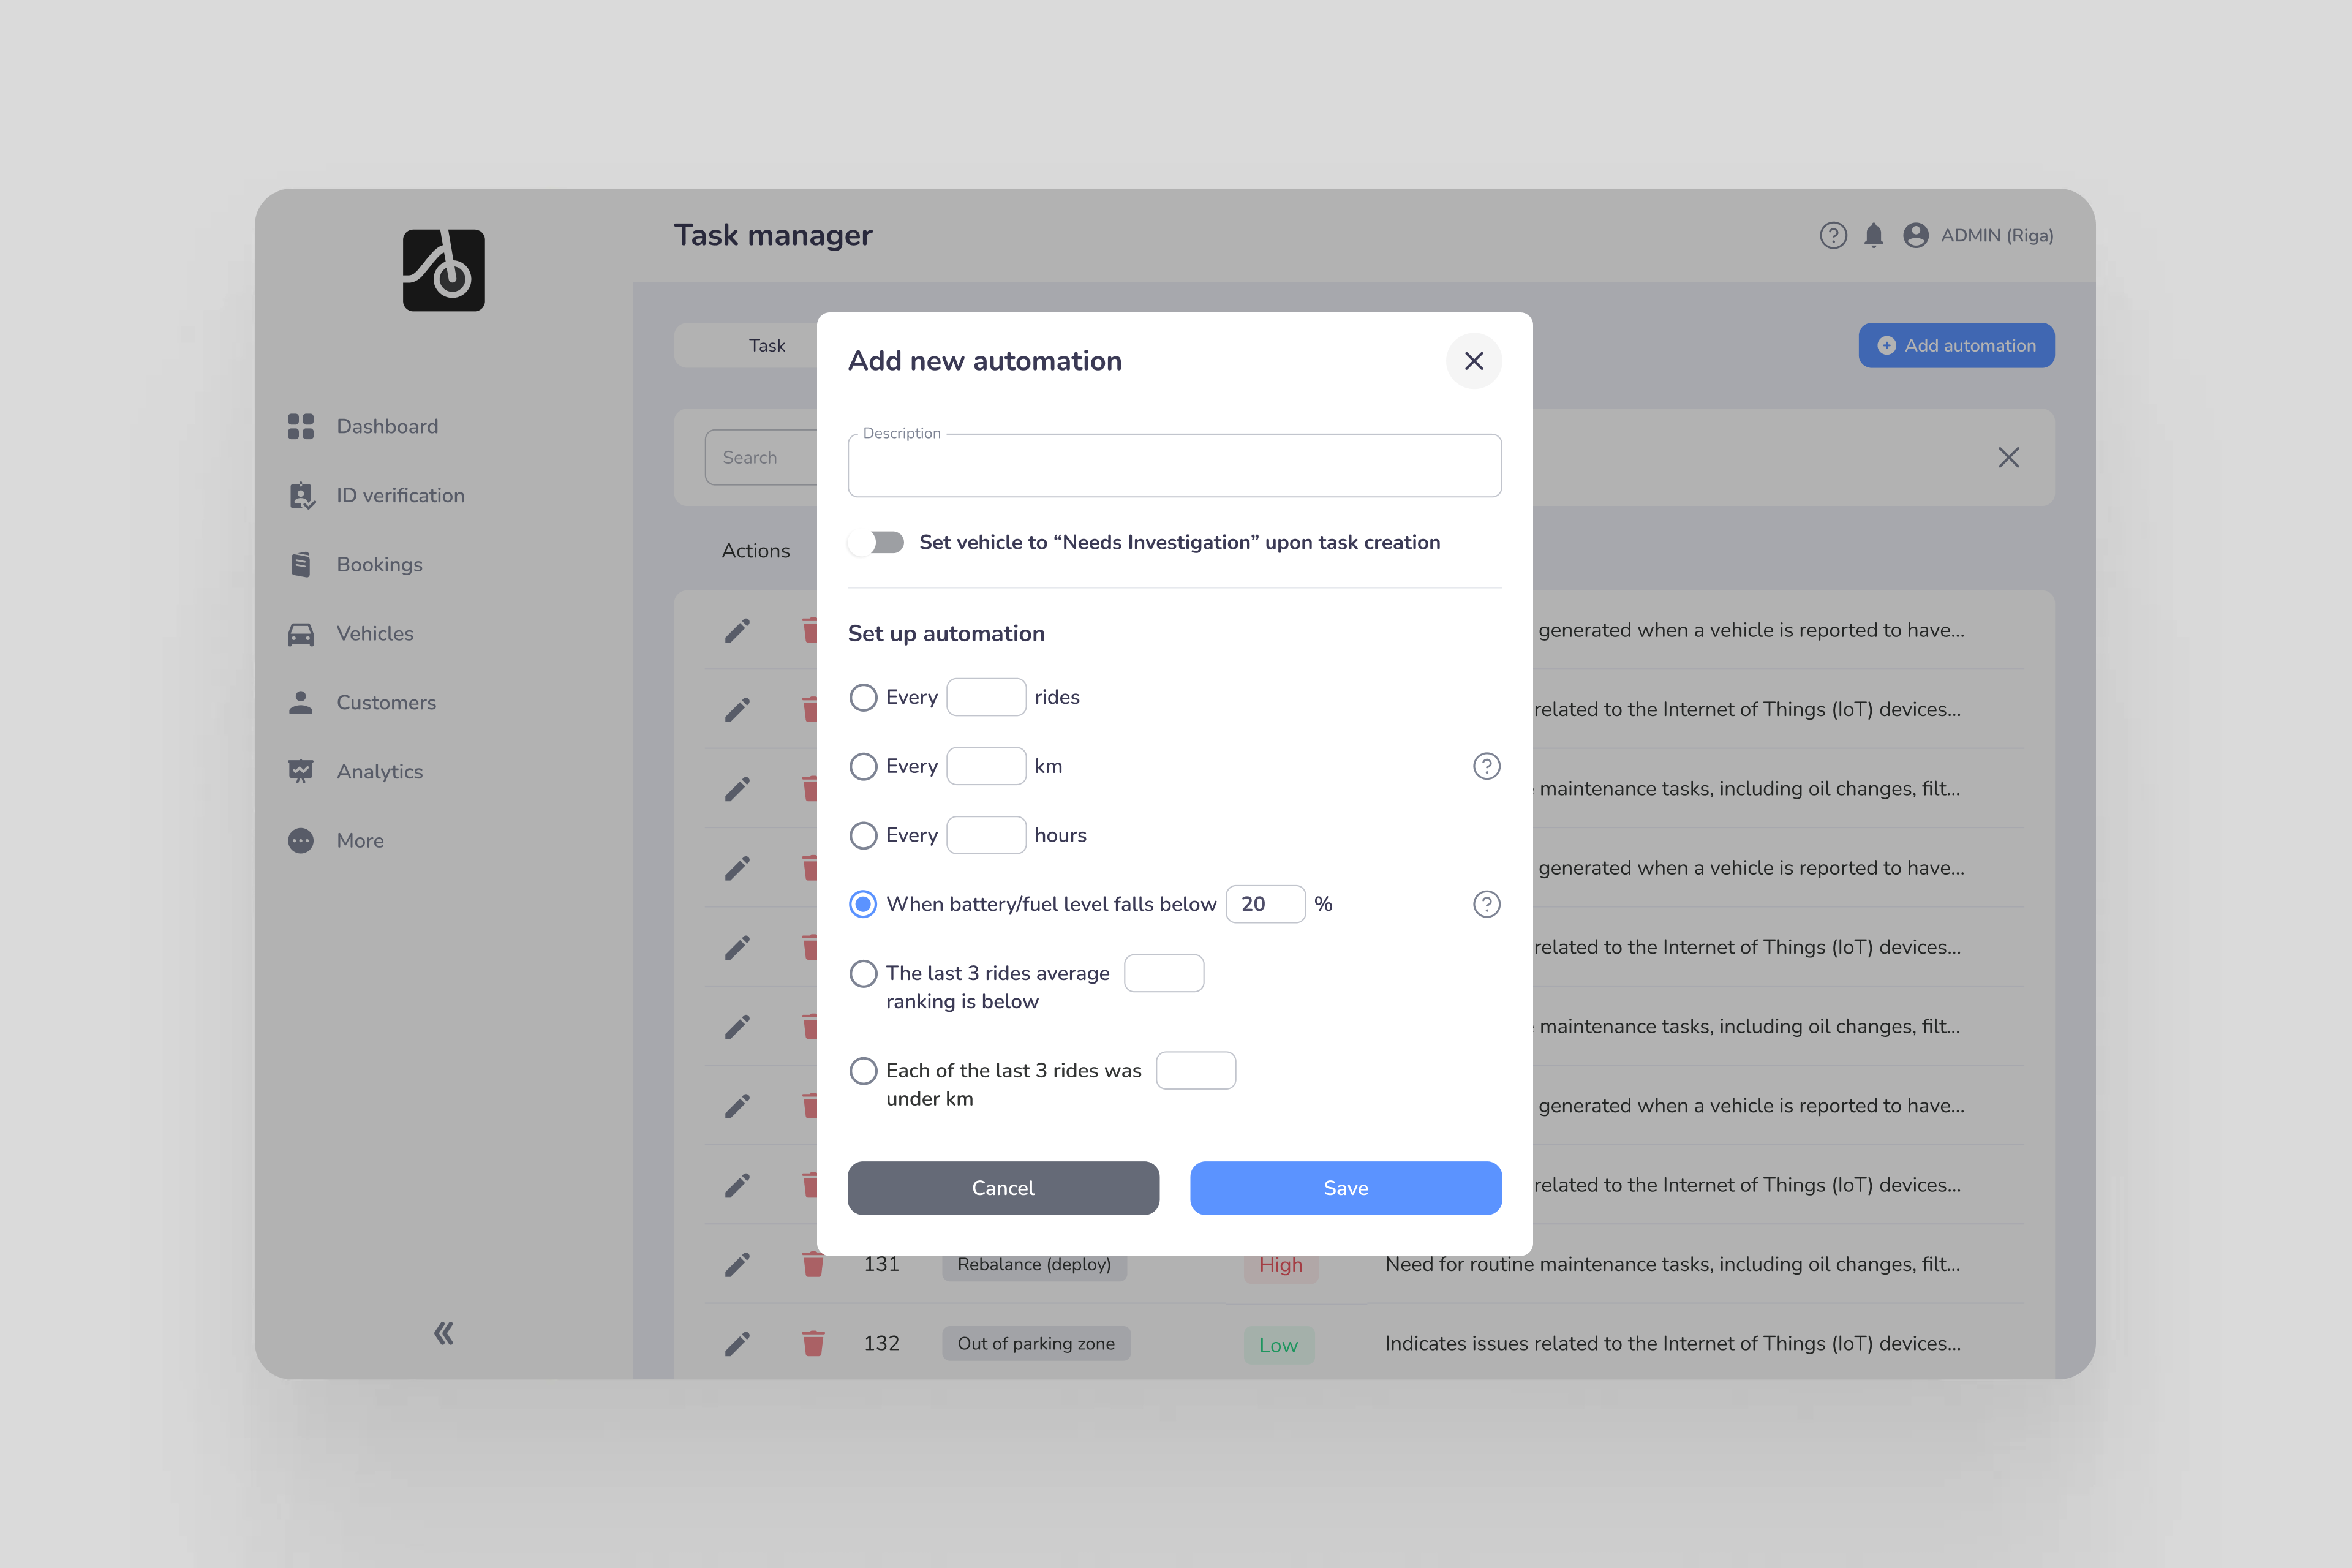
Keeping a fleet ready for customers means staying on top of maintenance, charging, refuelling, and service quality. As your fleet grows into hundreds of vehicles, manually tracking when each vehicle needs attention becomes increasingly time-consuming.
Task Manager automations turn vehicle usage, condition, and ride feedback into actionable tasks. Operators can configure tasks to be created:
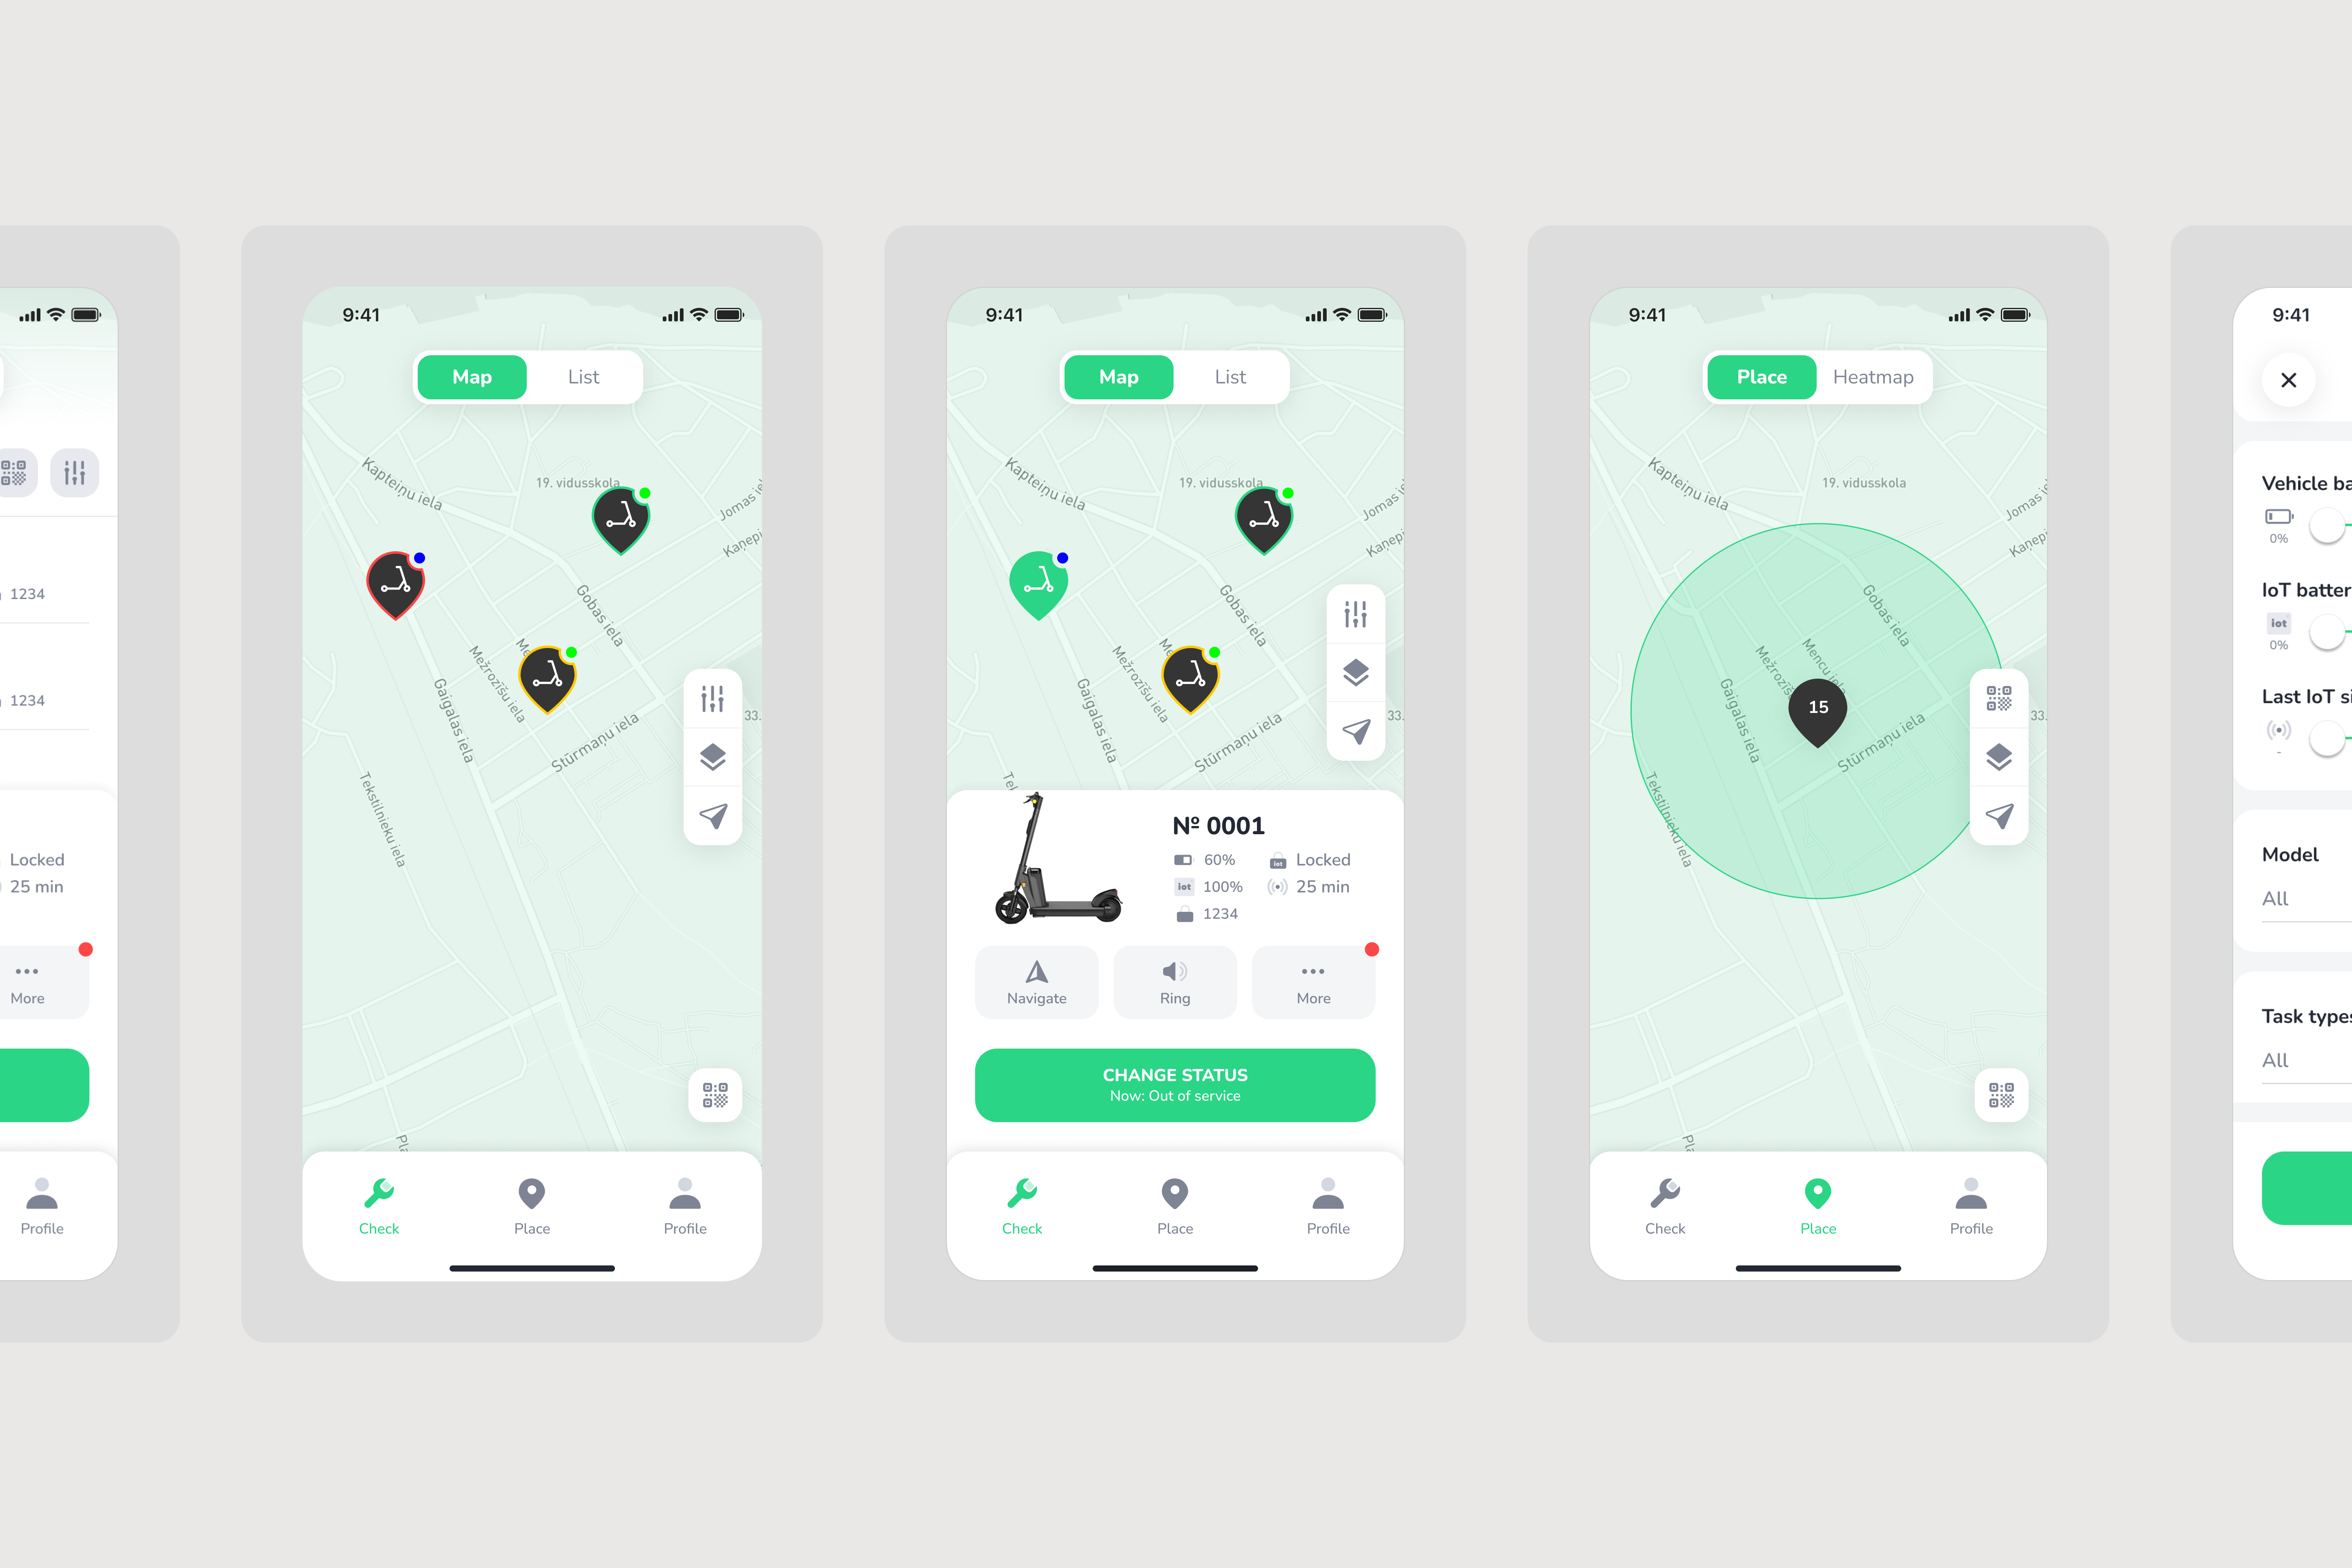
These rules can support routine maintenance, trigger charging or refuelling tasks, and flag vehicles for inspection after low ratings or unusually short rides. For rebalancing tasks, if a customer uses the vehicle before collection, the task is automatically removed. This reduces manual monitoring and helps your team respond to vehicles that need attention.
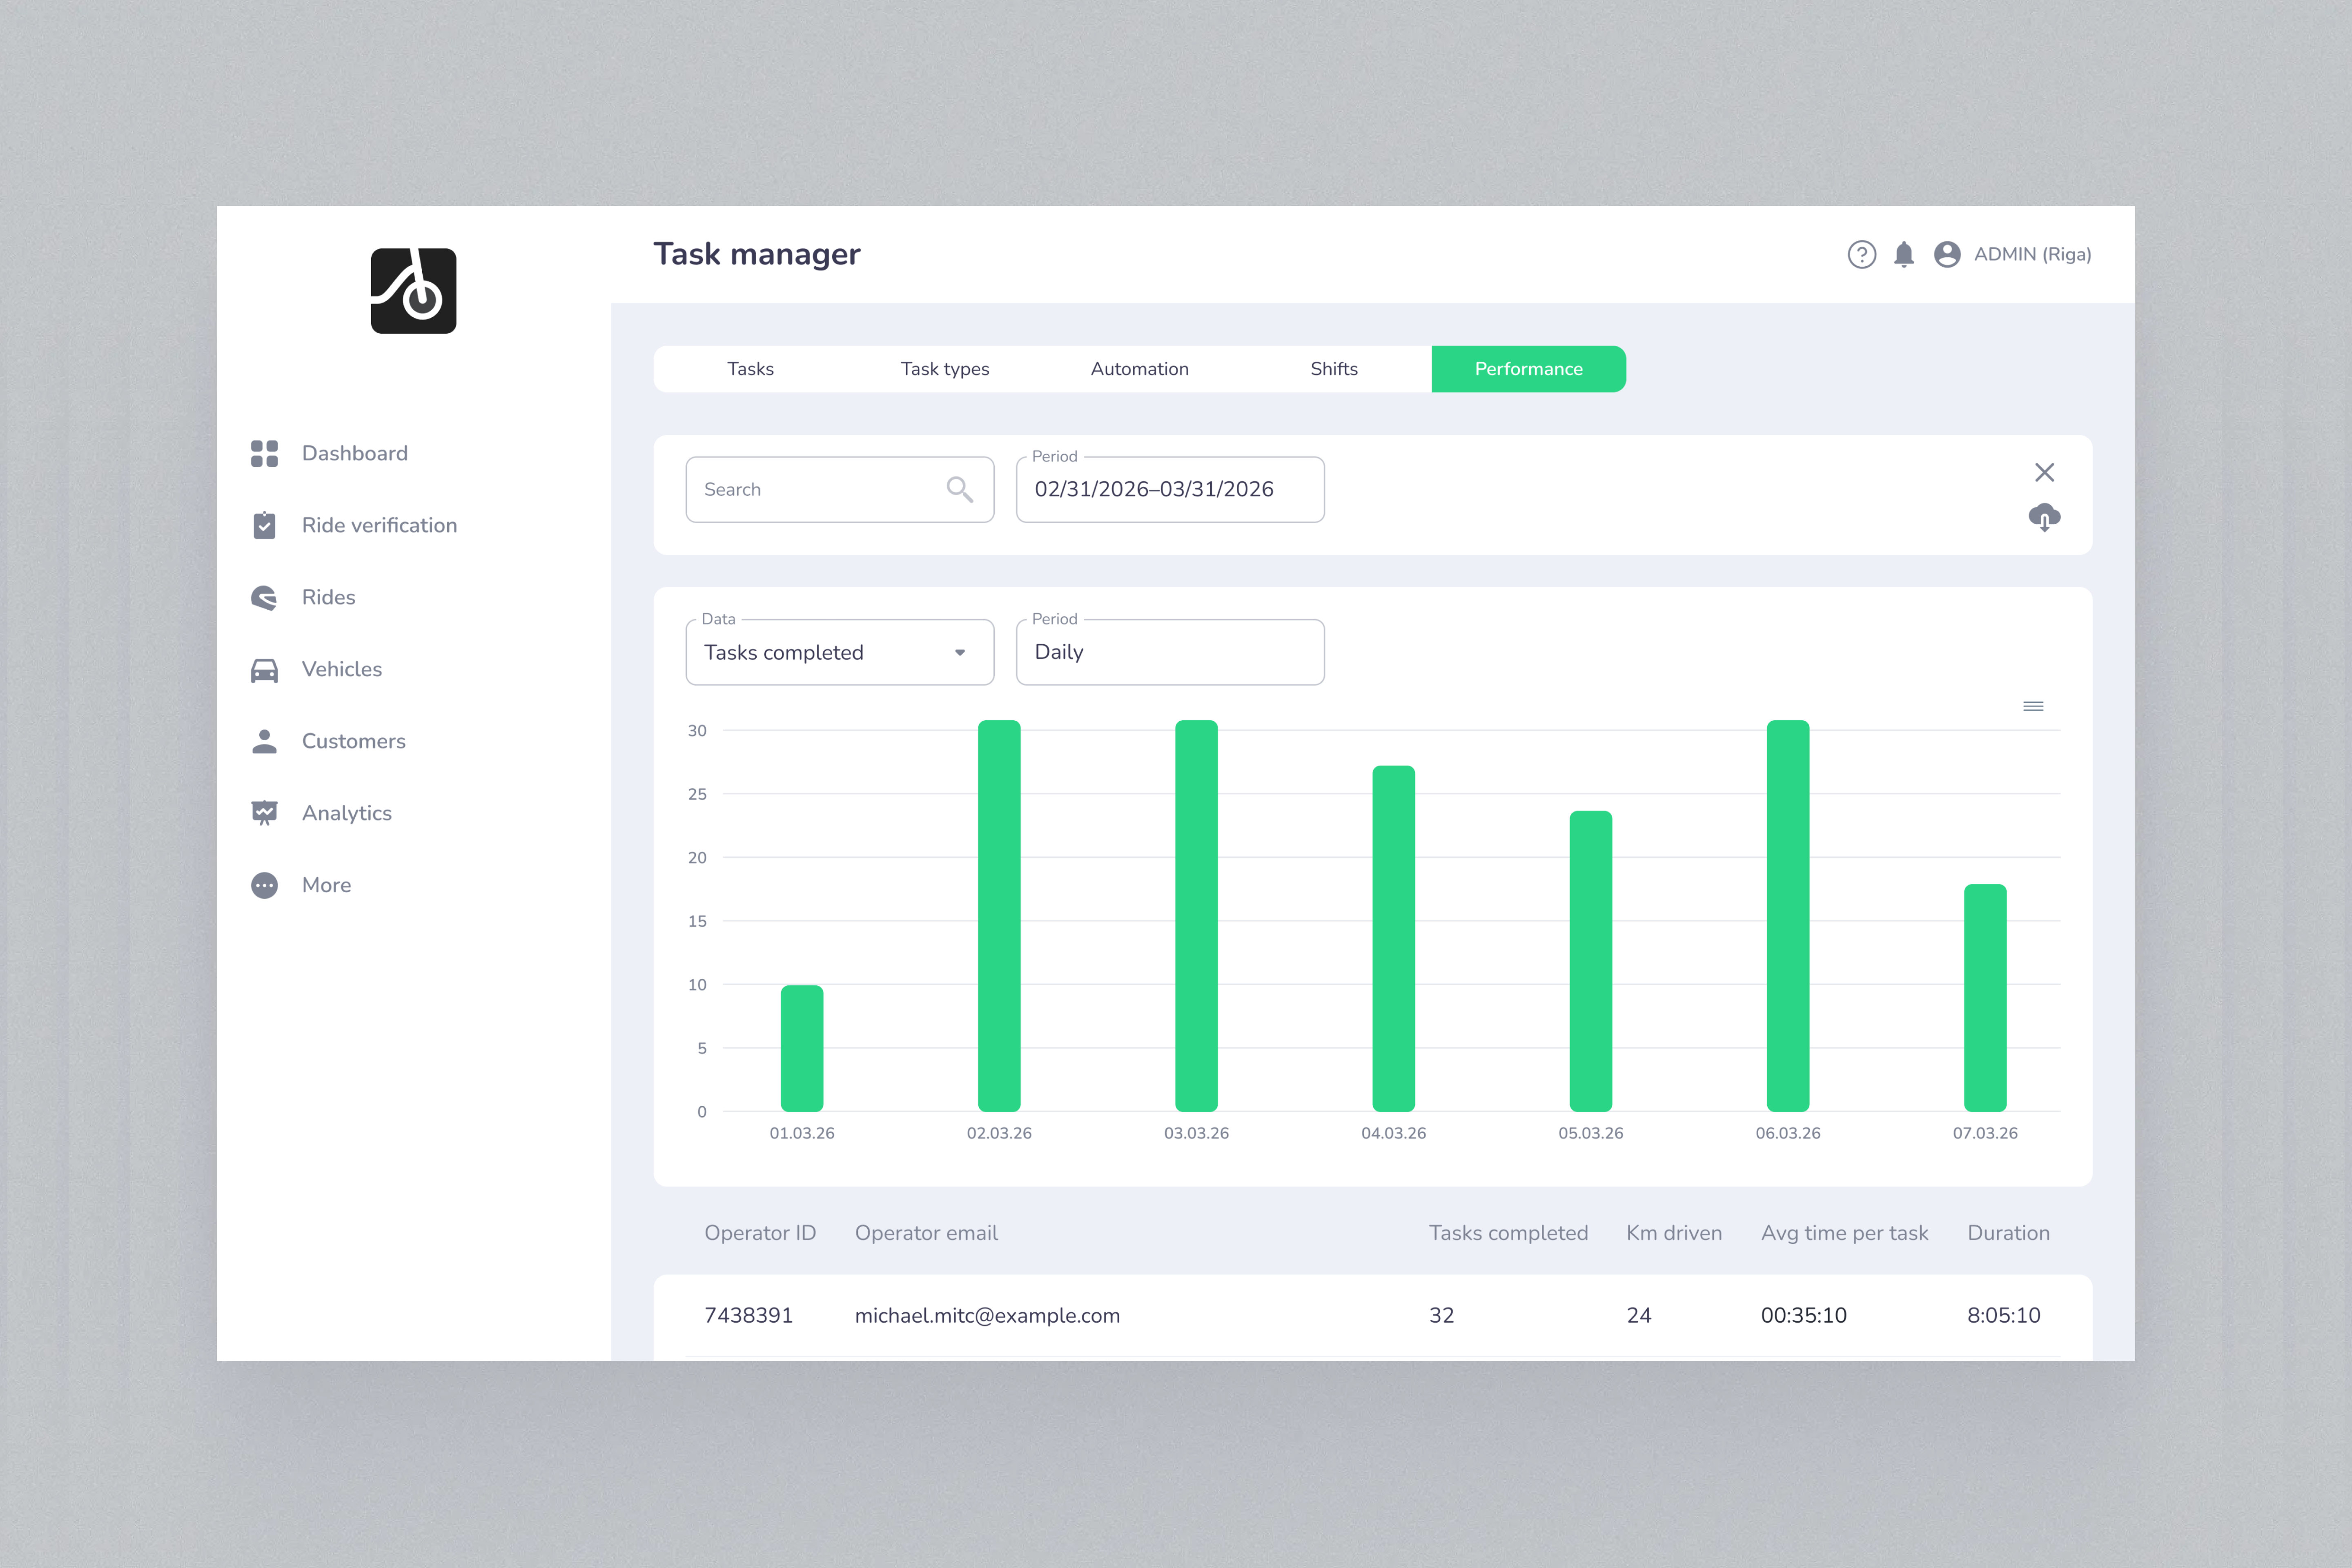
How long do tasks take? Where does your team spend its time? Which operational bottlenecks need attention?
New Shifts and Operator Performance views give vehicle sharing and digital rental operators visibility into shift status and duration, distance driven, completed tasks, and average time per task.
Managers can use these insights to investigate delays, improve routes, and identify training needs. For example, longer task completion times could prompt a closer look at travel distances, workload, or the processes used at each location. Comparing results alongside task types and working conditions helps turn performance data into practical operational improvements.
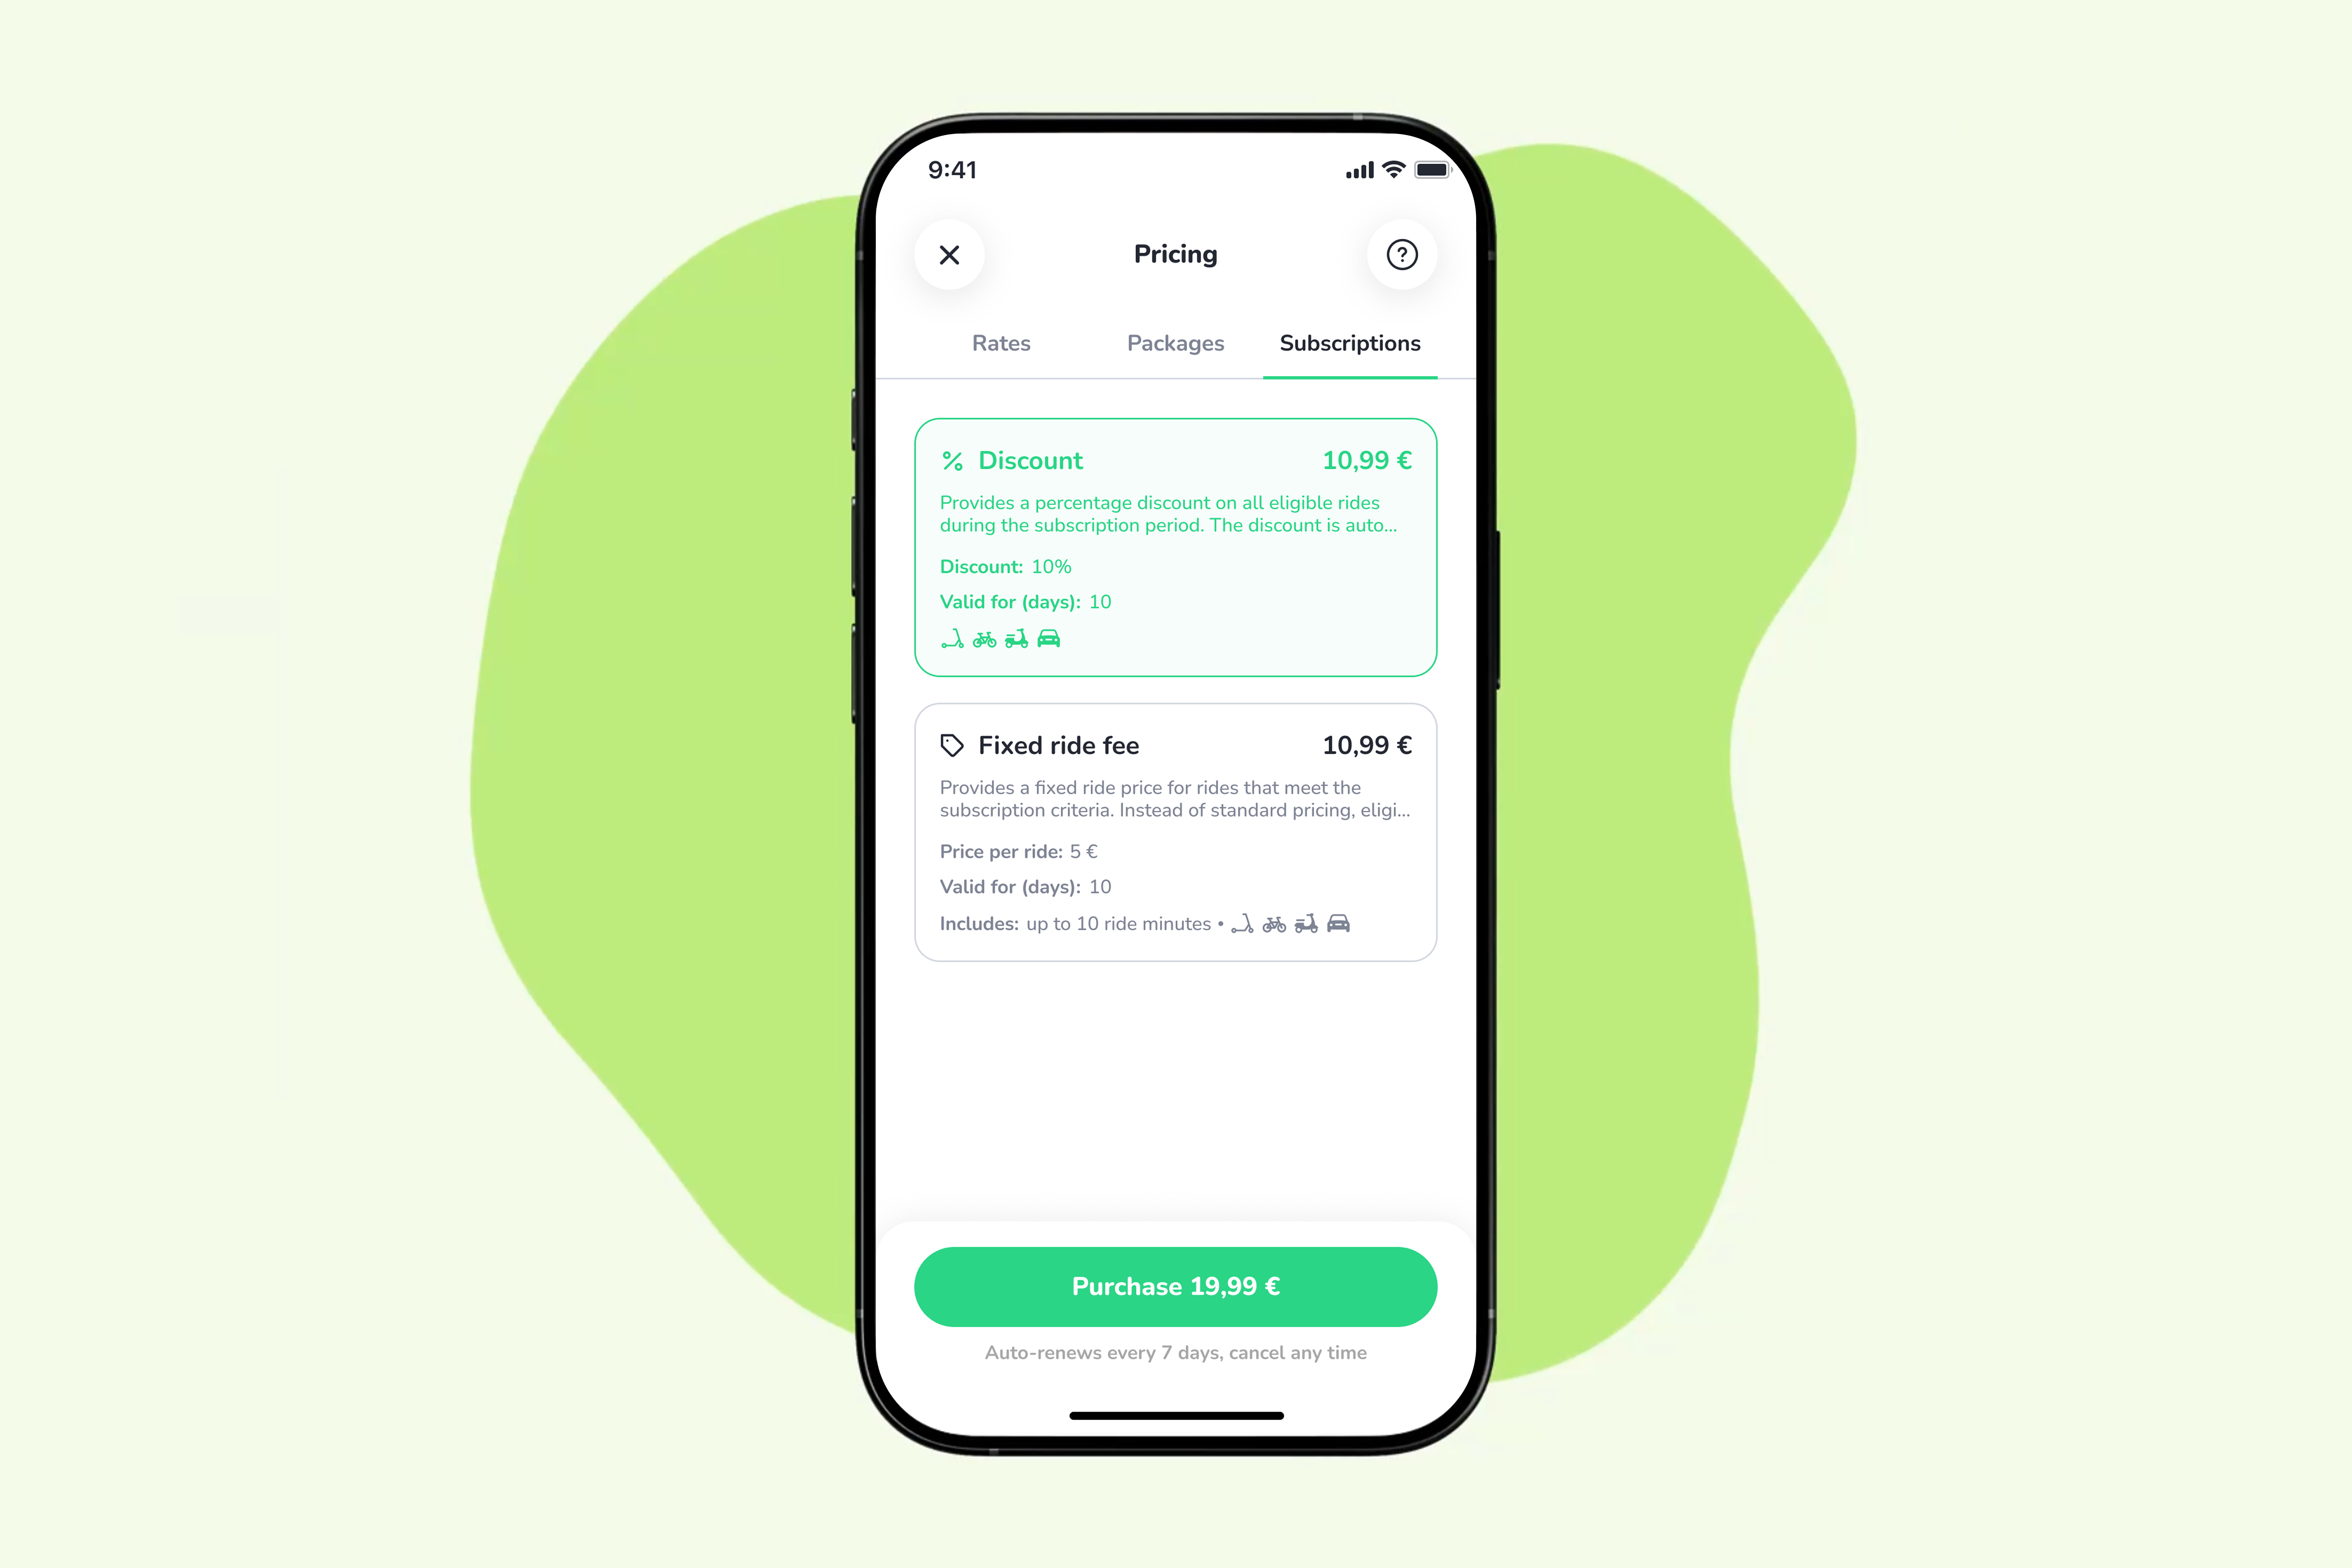
Different customers have different riding habits. Your subscriptions should reflect that.
ATOM Mobility now supports two additional subscription types:
These options let operators design offers around frequent riders and short-distance commuters. For example, you could offer subscribers a percentage discount on eligible rides or a predictable flat fee for qualifying short trips. Operators gain more flexibility to test offers that encourage repeat usage while fitting their pricing strategy.
Checking an active trip should be simple.
Live Activity lets customers view key ride information directly on their phone lock screen without repeatedly opening the app. Depending on the service, this can help them follow an active ride or a driver’s arrival.
Making this information readily accessible gives customers a more convenient way to stay informed throughout their journey.

These five releases are part of ATOM Mobility’s ongoing product development, helping operators identify unmet demand, automate routine coordination, understand field-team performance, and improve the customer experience.
Exploring software for your mobility business? Book a demo to see how ATOM Mobility can support your fleet, team, and customers.
Explore more product updates at https://www.atommobility.com/atomupdates

🛴 The global e-scooter sharing market is forecast to more than double from $1.54 billion in 2025 to $3.12 billion by 2030. But what does it take to run a profitable operation? We break down revenue, costs and the rides needed to break even - with a practical financial example.
A scooter rental business can be profitable when revenue from rides covers fleet operations, overhead and the cost of replacing vehicles. The key is understanding how much each scooter earns, how much it costs to keep it available, and whether the business can sustain that balance throughout the year.
The market outlook points to further growth. According to The Business Research Company, the global e-scooter sharing market is forecast to grow from $1.54 billion in 2025 to $3.12 billion by 2030 - more than doubling over five years. The report identifies demand for sustainable urban transport, investment in smart-city mobility and integration with public transport as growth drivers. For operators, this creates opportunities, but profitability still depends on local demand, fleet utilisation and operating efficiency.
A busy summer month does not necessarily mean a profitable year. Discounts, maintenance downtime, winter demand and vehicle replacement can all change the result.
This article focuses on app-based electric scooter sharing, where customers typically pay an unlock fee and a per-minute rate. Hourly or daily scooter rental businesses follow similar principles, but their pricing and operating costs differ.
Below, we break down the main revenue drivers, costs and calculations to help you assess the opportunity.
There is no single standard price. Rates vary by city, operator, vehicle type and subscription or ride package. Before launching, compare local competitors’ prices alongside permit conditions and customer demand.
A common scooter-sharing pricing structure combines:
For example, a €1 unlock fee and a €0.20 per-minute rate produce a €4 fare for a 15-minute ride:
Unlock fee + (ride duration × per-minute rate) = ride fare
€1 + (15 × €0.20) = €4
Bike-sharing services may use per-minute pricing, timed passes or subscriptions. For a mixed fleet, model bikes and scooters separately because pricing, usage and operating costs can differ.
For financial planning, distinguish the advertised fare from net realised revenue per ride: revenue after discounts, refunds and applicable sales taxes, but before operating expenses such as payment processing.
Subscription and package revenue should also be allocated consistently. Counting the full package purchase and then counting its covered rides as additional revenue would overstate income.
Once you have an estimated net revenue per ride, the next calculation is:
Monthly revenue = deployed scooters × rides per scooter per day × operating days × net revenue per ride
For example:
100 scooters × 2 rides × 30 days × €4 = €24,000 monthly revenue
This is an illustrative calculation, not an industry benchmark. Here, €4 represents net realised revenue rather than the customer-facing fare in the earlier example.
The next question is how much of that revenue remains after costs.
Scooter sharing pricing examples:

Bike sharing pricing examples:

Rides per scooter per day is one of the most important inputs in a scooter-sharing business plan. The same fleet can lose money or generate a profit depending on how frequently customers use it.
Demand depends on several local factors:
A larger fleet does not automatically mean better utilisation. Adding scooters where demand is already served can increase costs without producing enough additional rides.
For planning, test conservative, base and strong-demand scenarios rather than relying on one forecast. For example, you could model 1, 2 and 3 rides per deployed scooter per day, then replace these assumptions with local evidence or pilot results.
Keep the denominator consistent. If your utilisation figure counts only available scooters, account separately for vehicles that are charging, awaiting repair or otherwise unavailable. Applying an available-vehicle usage rate to the entire fleet can overstate revenue.

According to research conducted by the National Association of City Transportation Officials, scooters are making up to two times more rides per vehicle per day compared to bikes. Bike services complete anywhere from 0.5 to 2.5 rides per day at an average of 1, with trends showing a shift away from traditional pedal bicycles as the interest in e-vehicles continues to grow.

An evaluation of the City of Chicago’s E-scooter pilot program found that over time the number of trips per day decreased from an average of 3.7 to 2.5. This aligns with the seasonality of mobility vehicles, which has been proven to impact ridership. Our experience shows that there can be decreases between 30 to 50 percent during the off-season.
In short, the average rides per day you can count on for bike sharing services is 0.5 to 2.5, and 1.8 to 5 for scooter sharing services.
Revenue is only one part of the calculation. A useful financial model separates costs that change with ride volume from costs incurred per vehicle or across the business.
Vehicle acquisition and replacement
Include scooters, batteries, spare parts, shipping and deployment preparation. Estimate a realistic useful lifespan and residual value. Depreciation spreads the vehicle’s cost over that lifespan; your cash-flow forecast must also reflect when you actually pay for the fleet and its replacements.
Charging and battery swapping
Include electricity, staff time, collection or swapping routes, charging equipment and any spare batteries required. Electricity alone does not represent the full cost of keeping scooters charged.
Maintenance and repairs
Budget for inspections, tyres, brakes, labour and spare parts. Repairs also affect revenue when vehicles are unavailable.
Rebalancing and field operations
Scooters may need to be moved from low-demand locations, collected after incorrect parking or returned to service. Include field staff, service vehicles and transport costs.
Payment processing
Check both percentage fees and fixed transaction charges. Model these against the way customers actually pay, including individual rides, wallet top-ups and packages.
Software and connectivity
Include the vehicle-sharing platform, IoT connectivity, SIM cards and any additional integrations or services.
Customer support and marketing
Budget for rider enquiries, refunds, acquisition campaigns and retention activities. Account for promotional discounts in revenue so they are not inadvertently counted twice.
Permits, insurance and overhead
Include applicable city fees, insurance, storage, premises, management and administration. The requirements and costs depend on the operating market.
Theft, damage and losses
Allow for unrecovered vehicles and damage beyond normal maintenance. Avoid counting the same losses again within another cost category.
Seasonality
Forecast each month separately. Lower winter revenue may coincide with ongoing software, storage, insurance and staffing costs, even if part of the fleet is withdrawn.
The following simplified example shows how utilisation changes the result.
Illustrative assumptions - not ATOM customer averages or quoted supplier prices:
The resale assumption uses the midpoint of an estimated €100–€200 per scooter range after three years. Assuming all 100 scooters remain saleable, this gives a residual fleet value of €15,000.
Monthly depreciation is therefore:
(Fleet acquisition cost − residual value) ÷ useful lifespan in months
(€100,000 − €15,000) ÷ 36 ≈ €2,361 per month
Actual resale proceeds depend on vehicle condition, battery health, the number of scooters remaining saleable and selling costs.
The 40% variable-cost assumption provides a simple starting point for forecasting. In practice, charging, maintenance and field-operation costs depend on usage, staffing and local conditions, so they should be itemised as the business plan develops.
Fixed costs cover separate expenses that remain broadly unchanged across these scenarios. Allocate each expense only once to avoid double-counting staff, charging or maintenance.
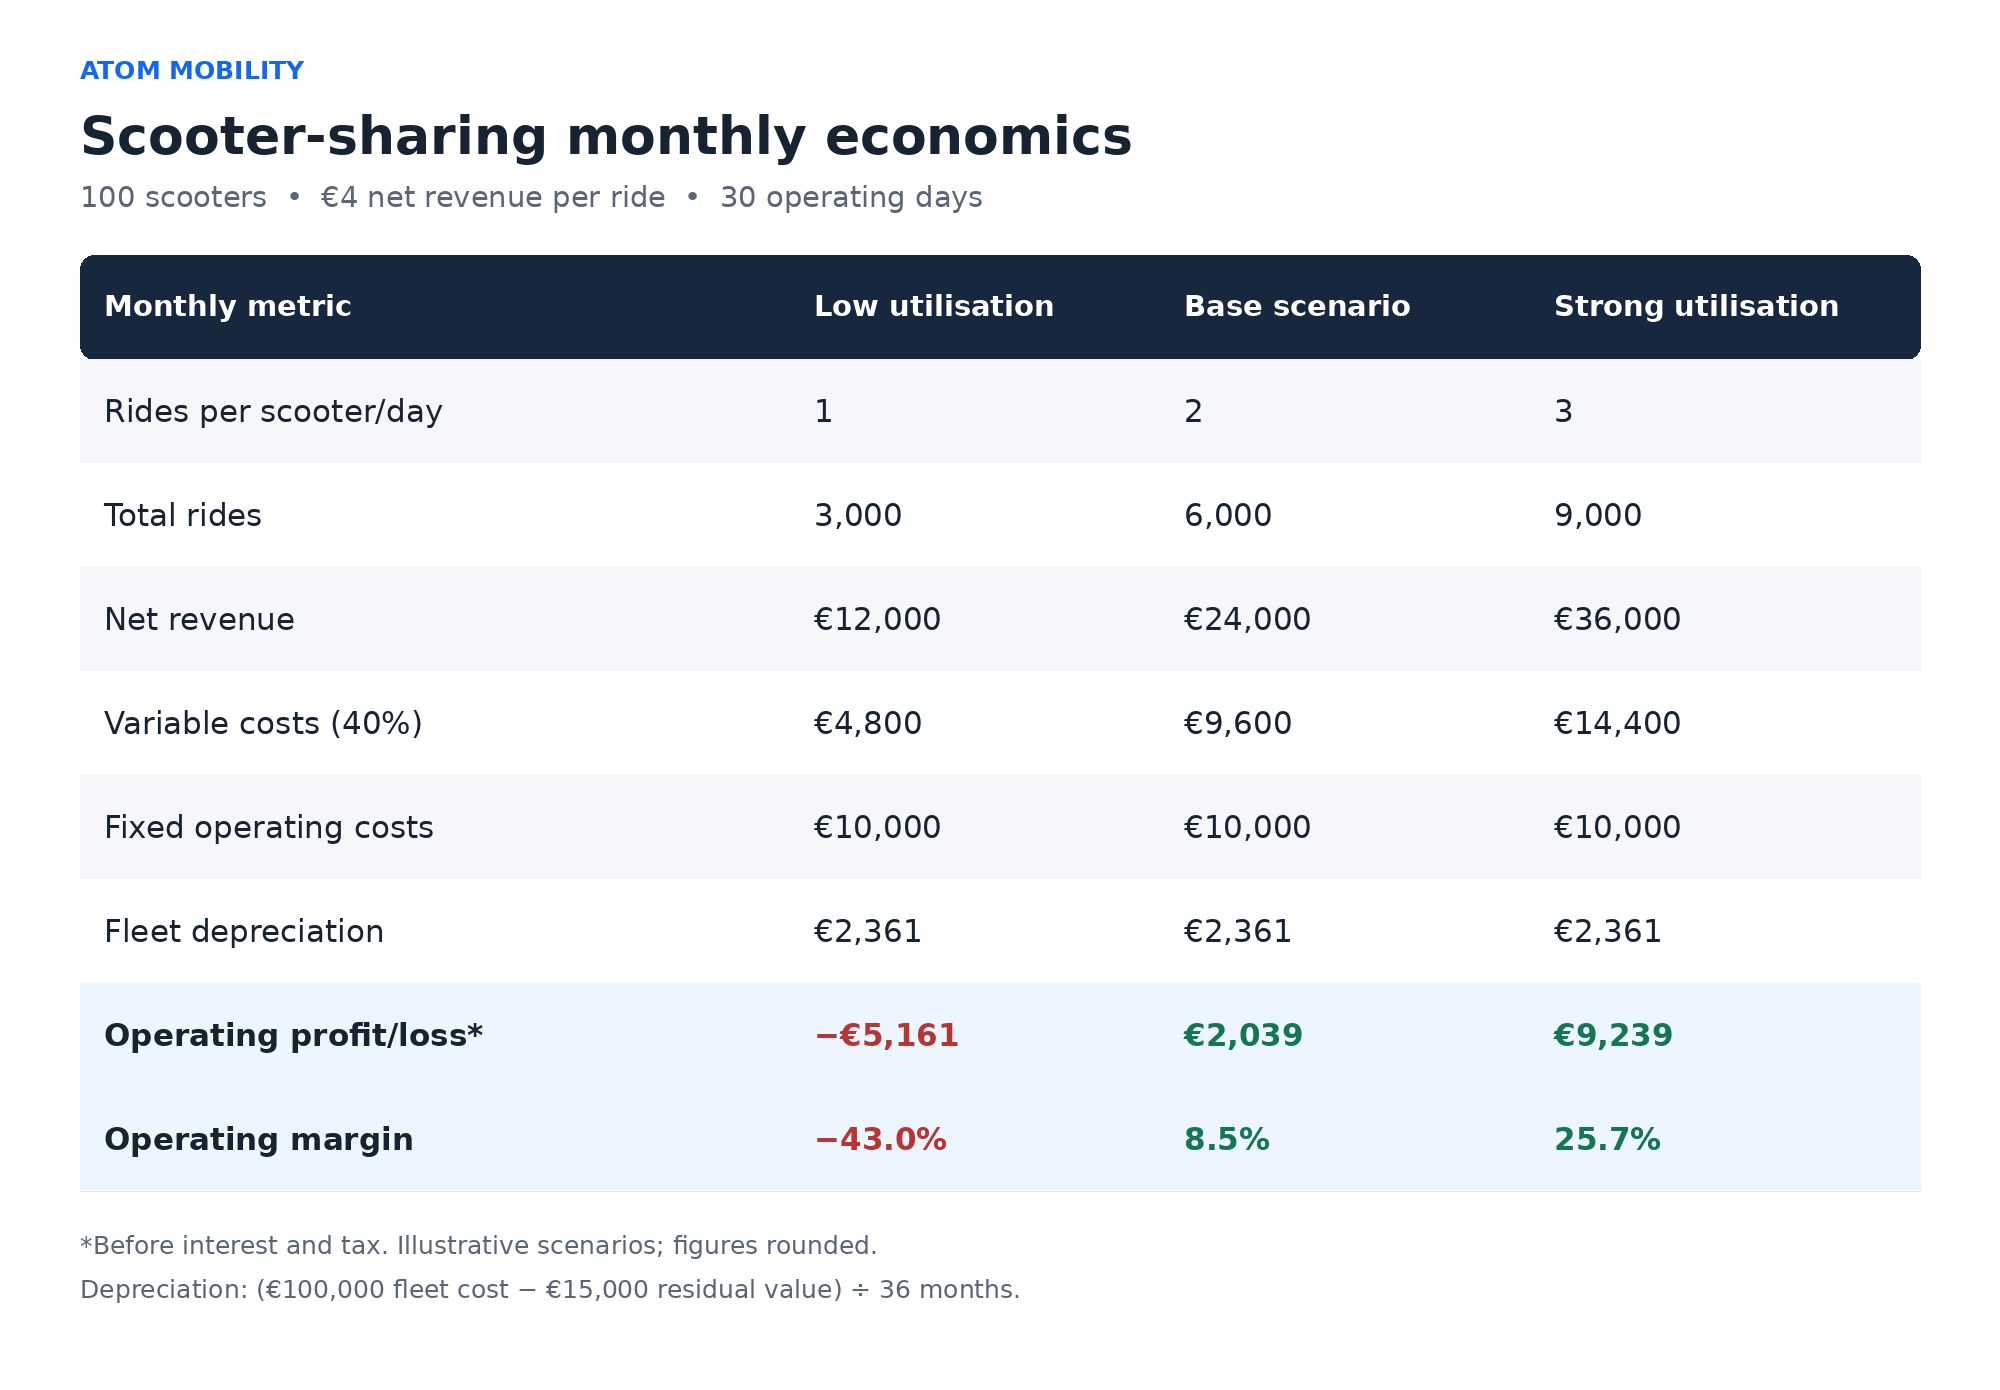
At one ride per scooter per day, the fleet does not generate enough revenue to cover its costs. At two rides, the business produces approximately €2,039 in monthly operating profit. At three rides, operating profit reaches approximately €9,239 per month before interest and tax.
The difference illustrates why utilisation matters: fixed expenses and depreciation continue even when scooters receive fewer rides. However, these monthly results should not be treated as annual forecasts without accounting for seasonality.
First, calculate the contribution from each ride:
Net revenue per ride − variable cost per ride = contribution per ride
In this example:
€4 − €1.60 = €2.40
Then calculate monthly operating break-even, including depreciation:
(Monthly fixed operating costs + depreciation) ÷ contribution per ride
(€10,000 + €2,361.11) ÷ €2.40 ≈ 5,151 rides per month
Across 100 scooters and 30 operating days, that equals approximately 1.72 rides per deployed scooter per day.
This threshold applies only to the assumptions above. Lower realised revenue, higher operating costs or fewer operating days would raise it. Additional staff or equipment needed to support higher utilisation would also change the calculation.
When testing a different ride price, reassess the underlying costs rather than automatically holding them at 40% of revenue. A price increase does not necessarily increase charging or maintenance expenses, and it may affect customer demand.
Profitability and investment payback are different measures. Operating profit accounts for depreciation, while payback measures how long it takes to recover the cash invested.
In the base scenario, monthly operating cash generation before capital expenditure, working-capital changes, financing and tax is:
€24,000 − €9,600 − €10,000 = €4,400
At that constant level, recovering the €100,000 fleet purchase alone would take approximately 23 months. This is a simplified illustration, not a complete investment payback forecast.
The estimated €15,000 fleet resale proceeds would be received when the scooters are sold at the end of year three. They reduce depreciation in the profitability calculation but do not provide cash during the preceding operating months.
An actual forecast should also include setup costs, spare batteries, charging equipment, initial marketing and working capital. It must account for seasonal demand, subsequent vehicle purchases and replacement costs. If the business continues after selling its original fleet, it will also need to fund replacement vehicles.
Model at least a full seasonal cycle and extend the forecast through the expected fleet replacement period. A strong summer month should not simply be multiplied by 12 to estimate annual returns.
Focus on changes that improve revenue or reduce costs while maintaining a reliable service:
Measure the financial effect of each change. More rides improve the business when the additional revenue exceeds the cost of serving them.
ATOM Mobility’s Excel-based financial model provides a starting point for assessing scooter- and bike-sharing profitability. It helps operators explore how pricing, ride duration, utilisation and operating costs affect their financial results.
The model uses percentage-based cost assumptions for an initial comparison. Adjust these inputs to reflect your market, then refine your forecast using supplier quotes, local permit requirements and a detailed operating budget.

Your forecast should help answer:
Build conservative, base and strong-demand scenarios, then update the assumptions as actual operating data becomes available.
Contact the ATOM Mobility team to request the model and discuss the assumptions for your planned operation.
A profitable scooter-sharing business depends on matching fleet size and operating costs to real local demand.
In the illustrative model above, operating break-even occurs at approximately 1.72 rides per scooter per day. This is not a universal industry threshold: each operator’s result depends on pricing, cost structure, vehicle availability, lifespan and seasonality.
Before expanding, validate these fundamentals across a full operating cycle. Improving the performance of an existing fleet may generate better returns than adding more scooters.
The right software supports that work by helping operators manage pricing, monitor fleet activity, organise maintenance and understand usage patterns.
Planning a launch or reviewing an existing operation? Explore ATOM Mobility’s vehicle-sharing software and contact our team to discuss your fleet and request the financial model.
🚲 The biggest costs in shared mobility are often the ones riders never see. Behind every trip is a constant cycle of fleet balancing, maintenance, charging, customer support, and compliance. As fleets grow, these operational costs can have a bigger impact on profitability than the vehicles themselves. This article explores the hidden costs that shape every shared mobility business.
Shared mobility often looks simple from the outside. A user opens an app, unlocks a vehicle, completes a trip, and moves on with their day. But not everybody knows that the system behind every ride is a bit more complex and can be quite expensive. For many operators, the biggest expenses are not always the most obvious ones.
As shared mobility continues to grow across Europe, operators face increasing pressure to improve efficiency while maintaining service quality. According to the latest European Shared Mobility Index, shared mobility services generated more than 700 million trips across Europe in 2025, reflecting continued demand for alternative transportation options. At the same time, profitability remains one of the industry's biggest challenges.
Across more than 300 shared mobility projects worldwide, one pattern appears consistently: operators often underestimate operational costs during launch planning while focusing primarily on fleet acquisition, permits, and launch activities. The largest challenges often emerge later through day-to-day operations, where downtime, fleet balancing, maintenance, customer support, and compliance costs gradually impact profitability.
Every shared vehicle is an asset that only generates revenue when it is available to users. A scooter waiting for repairs, a bike with a flat tire, or a car that has not been inspected after damage generates no revenue at all. For example, a scooter generating an average of two rides per day at €3 per ride produces roughly €2,200 in annual revenue. If recurring maintenance issues keep that vehicle unavailable for two weeks each quarter, the shared mobility operator could lose more than €250 in annual revenue from that vehicle alone. Across hundreds or thousands of vehicles, downtime quickly becomes a significant operational cost.
Yet the costs continue to build up – insurance, depreciation, financing, storage, and operational overhead do not stop simply because a vehicle is unavailable.
This becomes particularly noticeable as fleets grow. A single inactive vehicle may not seem significant but hundreds of inactive vehicles spread across multiple cities quickly become a major financial problem.
That is why many operators invest heavily in fleet visibility and operational tools. Platforms such as ATOM Mobility's vehicle sharing software help operators monitor vehicle status in real time and identify issues before they affect large parts of the fleet.
One of the least visible costs in shared mobility is fleet redistribution. Users naturally travel between different parts of a city. Over time, vehicles begin clustering in some areas while disappearing from others. The result is familiar to most operators – too many vehicles where demand is low and not enough where demand is highest. Solving this problem requires people, vehicles, planning, and technology. Large operators often maintain dedicated teams responsible for things like fleet redistribution, battery swapping, charging operations, station monitoring and demand forecasting.
Academic studies of bike-sharing systems consistently identify balancing and redistribution as some of the biggest operational challenges because they directly affect both utilisation and customer satisfaction. When users cannot find a vehicle nearby, they often choose another transport option instead. It’s even more difficult during big events, tourist seasons, weather changes, and rush hours when demand patterns shift rapidly.
For operators managing electric scooters, bikes, and mopeds, battery charging creates another layer of operational complexity. Vehicles must be collected, charged, swapped, and returned to high-demand locations. Labour, logistics, warehouse space, charging infrastructure, and electricity costs all contribute to the overall cost of fleet operations.
As fleets grow, charging efficiency becomes increasingly important. Poor battery management can increase downtime, reduce vehicle availability, and create unnecessary operational costs. For operators managing thousands of electric vehicles, charging and battery-swapping operations can require dedicated teams, warehouses, charging infrastructure, and specialised software to coordinate daily tasks efficiently.
Most vehicle problems start as minor issues but then become a bigger problem. A slightly damaged brake, a worn tire, a loose component, or a battery performing below normal levels may not immediately remove a vehicle from service. Left unresolved, however, these issues often become larger repairs that require more time, more money, and more operational effort.
For this reason, maintenance is no longer viewed as a reactive task by many successful operators. Instead, it is becoming an ongoing operational process supported by automation, diagnostics, and task management systems. So it’s important to identify problems before users do.
Many operators are moving toward more structured maintenance workflows, similar to the approaches discussed in ATOM Mobility's fleet management automation insights.
Customer support is often not thought enough about during launch planning. Founders typically focus on vehicles, apps, and pricing. Few spend enough time calculating the operational cost of helping users when things go wrong.
Support requests usually involve payment issues, failed unlock attempts, damaged vehicles, parking questions, account verification, trip disputes and other day to day problems. A fleet generating 100,000 monthly rides may receive hundreds or even thousands of support requests related to payments, parking violations, damaged vehicles, or account verification.
The cost of poor support is often higher than the cost of support itself because unresolved issues directly affect retention and reviews.
The shared mobility industry has grown significantly. A decade ago, many cities welcomed operators with relatively few requirements. Today, most cities expect detailed reporting, parking compliance, safety measures, accessibility standards, and operational transparency.
Operators increasingly need to invest in:
These requirements create additional costs, but they are quickly becoming part of doing business in the sector. At the same time, cities are becoming more selective about which operators receive permits and long-term partnerships, making operational quality an increasingly important competitive advantage.
Hidden costs rarely appear in business plans or launch announcements. They emerge gradually through downtime, maintenance, balancing, customer support, charging operations, and compliance requirements. Individually, each cost may seem manageable. Together, they often determine whether a mobility business becomes profitable.
Shared mobility businesses often talk about fleet size, market expansion, and trip volume. The operators that build sustainable businesses tend to focus on a different set of metrics, including vehicle utilisation, downtime, maintenance efficiency, and operational automation. Growth still matters, but it becomes expensive quickly when operational control is lacking.
Across the shared mobility industry, operational excellence is increasingly becoming a stronger competitive advantage than fleet size alone.
Many of the hidden costs discussed in this article can be reduced through better operational visibility and automation. Modern mobility management platforms help operators monitor fleet health, detect issues before they lead to downtime, automate maintenance workflows, prioritise field operations, optimise redistribution using real-time demand data, coordinate charging and battery-swapping activities, automate refunds for unsuccessful rides, and generate compliance reports with no manual effort.
At ATOM Mobility, we've seen these challenges across more than 300 shared mobility projects worldwide. While every market is different, operators that invest in operational efficiency early are often better positioned to achieve sustainable growth and profitability.

🚲 While dockless scooters and e-bikes often seems to be the popular choice, many of Europe's most popular shared mobility programs are station-based bike-sharing networks. Systems like Vélib' in Paris, Bicing in Barcelona, and BikeMi in Milan continue to grow by combining predictable parking, strong integration with public transport, and increasingly popular e-bike fleets. What these programs have in common, how they operate at scale, and why many cities continue investing in station-based bike sharing?
During 2019-2025, most of the attention in shared mobility went to dockless scooters. They were quick to deploy, highly visible, and seemed like the future of urban transport. But while many scooter operators expanded, consolidated, or exited markets, station-based bike-sharing systems quietly continued growing.
According to the 2025 European Shared Mobility Index, public bike-sharing schemes generated around 238 million trips in Europe, while private bike-sharing operators recorded another 124 million trips. Together, bike-sharing services accounted for more than 360 million annual rides out of more than 700 million rides (the other half was generated by free-floating scooters). While the industry spent years experimenting with different models, station-based bike sharing remained remarkably resilient. In many cities, it has become part of everyday transport infrastructure rather than simply another mobility service.
One of the clearest themes from the latest index is that the market is becoming more disciplined. Operators are no longer chasing every possible market. Instead, they are focusing on locations where shared mobility can operate sustainably over the long term. Cities are becoming more selective too, favouring systems that fit into wider transport networks rather than uncontrolled fleet expansion.
This shift has created favourable conditions for station-based bike-sharing systems. Unlike dockless fleets, station-based programs offer more predictable parking, easier fleet management, and stronger integration with public transport. These advantages become increasingly important as cities focus more on accessibility, compliance, and long-term mobility planning.
The strongest argument for station-based bike sharing is the performance of some of the world's largest programs.
Paris' Vélib' remains one of the most successful bike-sharing systems in Europe. The network combines thousands of regular bicycles and e-bikes across an extensive station network that covers much of the city. Vélib' generated approximately 48.5 million trips in 2025, making it the highest-ridership public bike-sharing system in Europe.

What makes Vélib' particularly interesting is that, for many Parisians, it has become part of their daily commute alongside buses, metros, and trains. That level of adoption only happens when riders know they can reliably find and return bikes where they need them.
Barcelona's Bicing demonstrates how station-based systems can scale with city support and careful planning. The system combines regular bicycles and e-bikes and has become deeply integrated into the city's transport ecosystem. Bicing recently surpassed 100 million total rides, making it one of the most successful public bike-sharing programs globally. Barcelona is becoming a fascinating mobility case study: shared scooters were banned, private dockless bike-sharing is being phased out, while the city continues expanding the public Bicing network. A clear signal that some cities are prioritizing station-based and publicly managed micromobility over free-floating models.
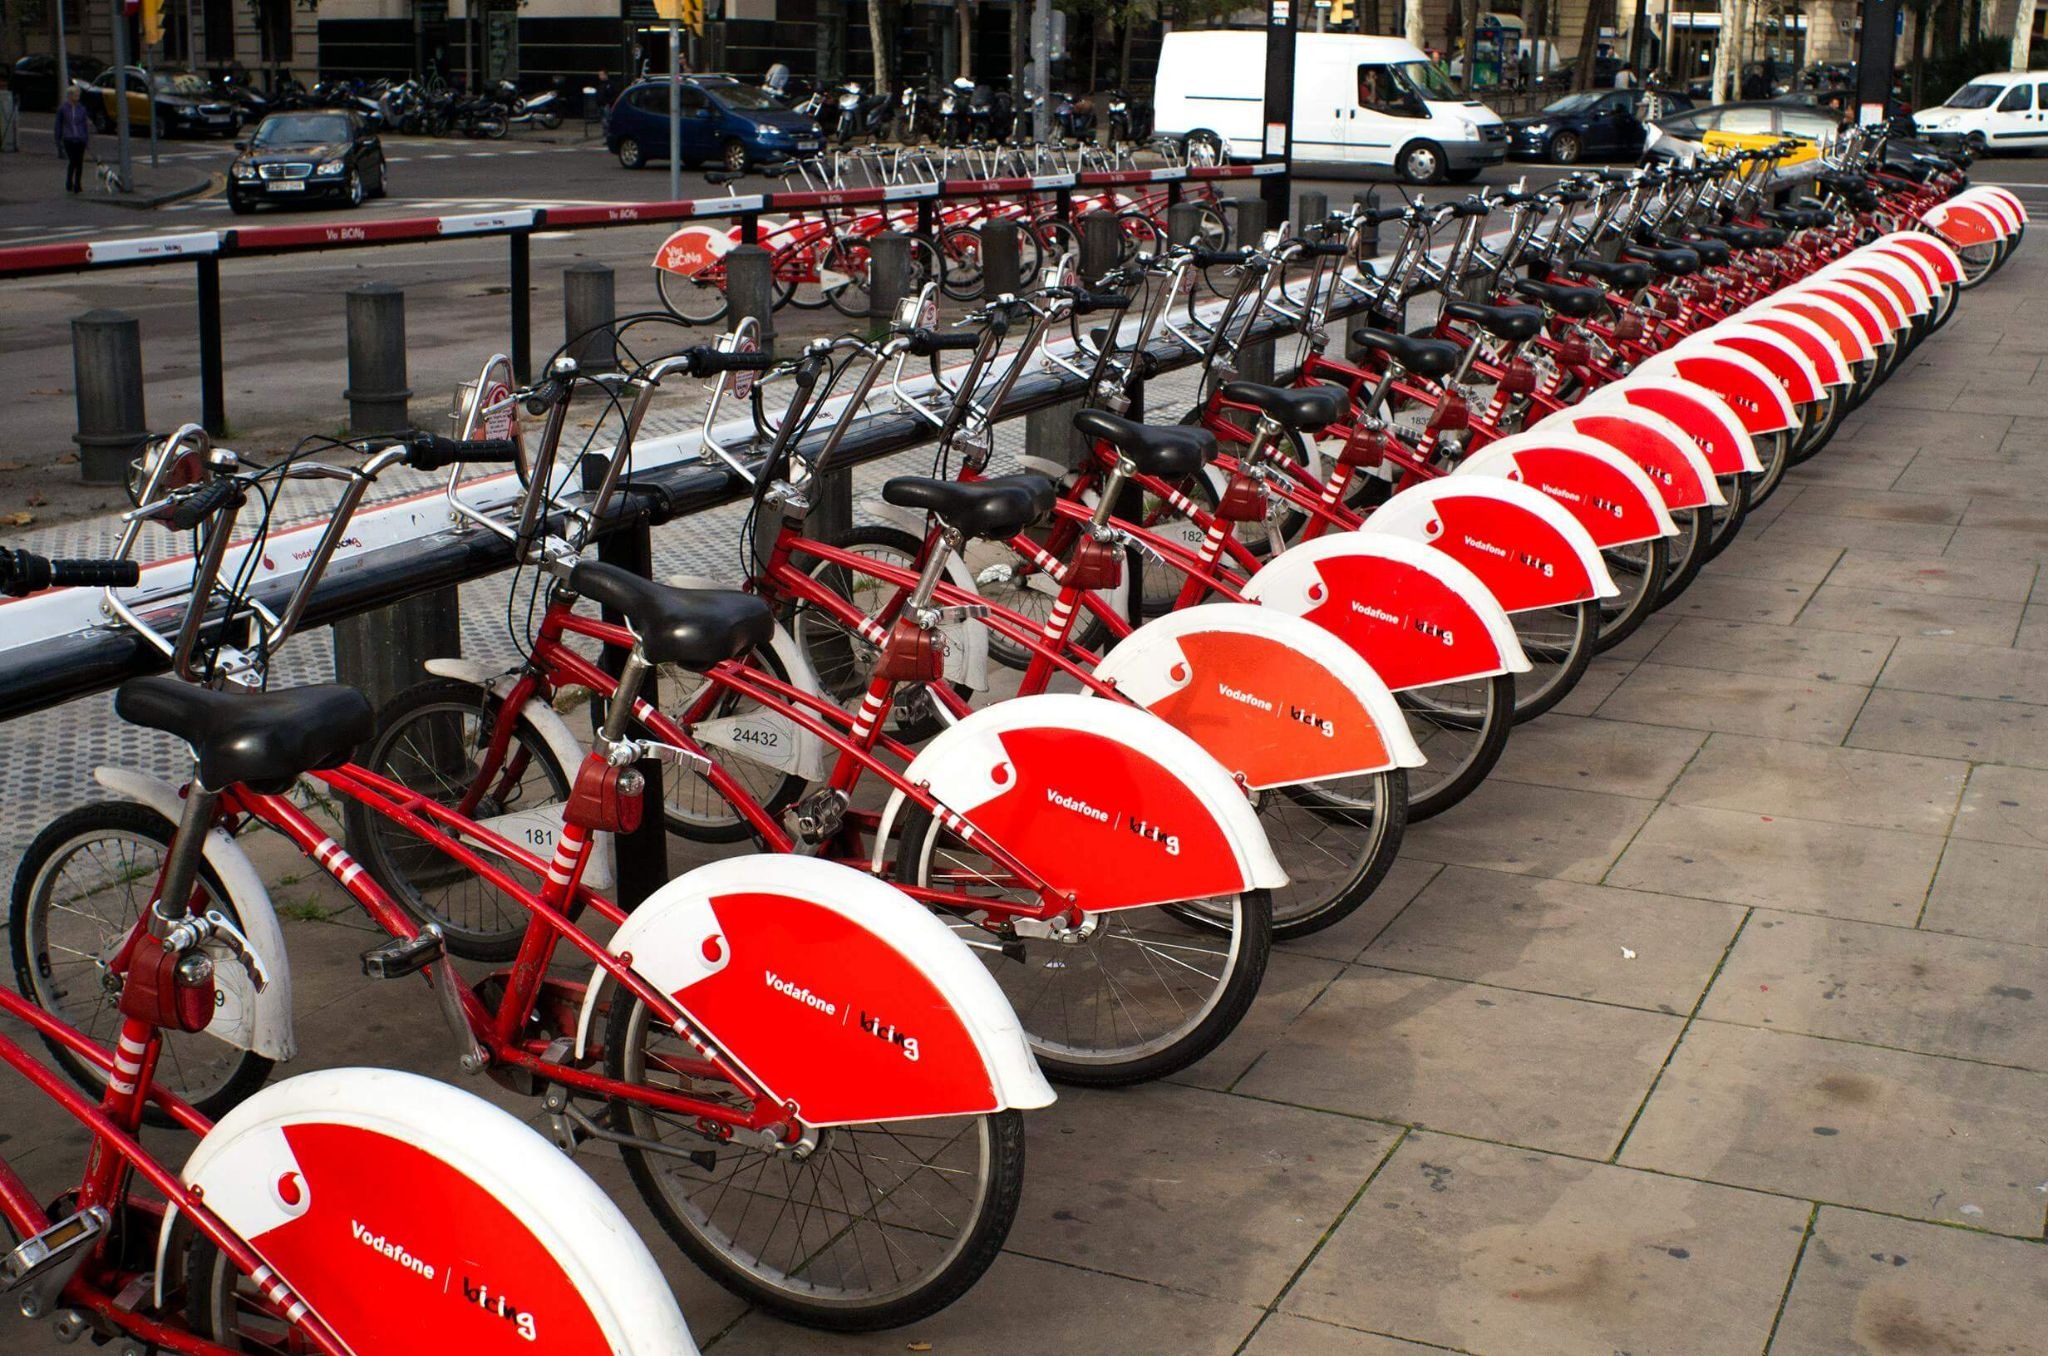
The success of Bicing also reflects a broader trend in Spain, where public bike-sharing systems continue receiving strong institutional support.
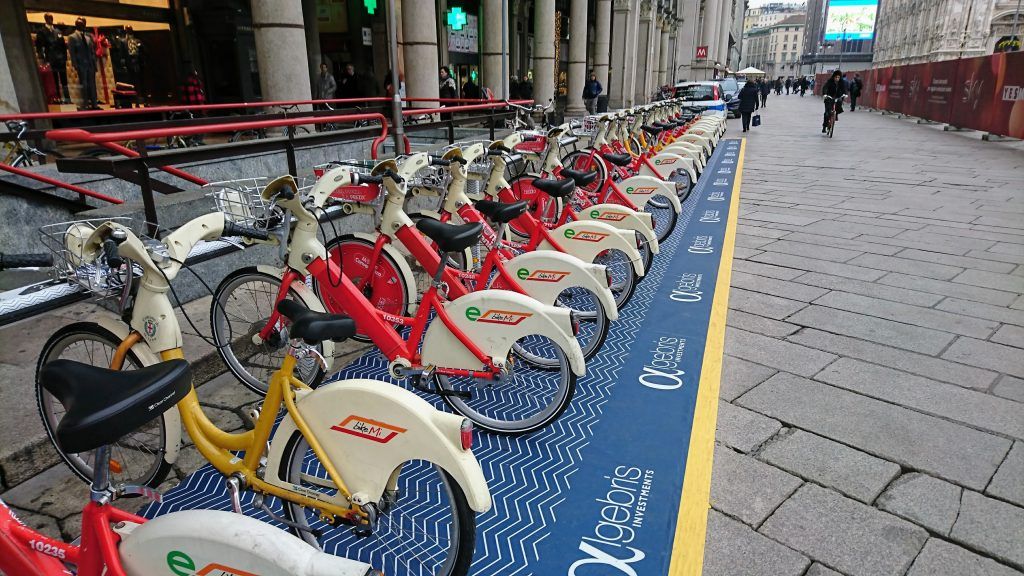
BikeMi in Milan offers a slightly different model. Rather than focusing on rapid expansion, the system grew steadily through dense station placement, strong commuter adoption, and integration with public transport. Now BikeMi combines traditional bicycles and e-bikes, providing a reliable transport option for both residents and visitors. Its success highlights an important lesson for operators: long-term utilisation often matters more than rapid fleet growth.

Although Vélib', Bicing, and BikeMi differ in scale and geography, they share several common characteristics. All three prioritise station density, integration with city transport networks, and predictable rider experiences.
One of the biggest developments in station-based bike sharing over the past few years has been the rapid growth of electric fleets. Public bike-sharing fleets are now approximately 48% electrified. More importantly for operators, electric bikes consistently generate more trips than traditional bicycles. Public systems average around 2.7 trips per vehicle per day, while some electric bike fleets achieve up to 4.6 trips per vehicle per day.
Higher utilisation means more revenue per vehicle, a faster return on investment, lower idle fleet costs, and stronger demand throughout the day. Electric bikes also make bike sharing accessible to a broader audience. Longer distances become practical, hills become less of a barrier, and riders who would not normally choose a bicycle are often willing to use an e-bike instead. This is one reason many newer station-based systems are launching with mixed fleets or even fully electric fleets from day one.
Across Europe, municipalities are placing greater emphasis on organised mobility systems that can be integrated into existing transport networks. The European Shared Mobility Index highlights several examples, including public support programs for bike-sharing subscriptions in Spain, continued investment in Barcelona's Bicing network, and London's decision to renew its Santander Cycles contract through a long-term investment programme.
For cities, the appeal is relatively clear. Station-based systems provide predictable parking, reduce street clutter, simplify accessibility planning, and make it easier to integrate bike sharing with buses, trains, and metro systems. As regulations become stricter and public space becomes more valuable, these advantages are becoming increasingly important.
As fleets grow, operators need visibility into station occupancy, vehicle availability, charging status, maintenance workflows, payments, rider activity, and customer support. Managing these processes manually quickly becomes difficult, especially when systems expand across multiple districts or cities.
Many operators use platforms such as ATOM Mobility's bike-sharing software to manage stations, vehicles, rider applications, payments, maintenance, and operational workflows through a single system rather than relying on multiple disconnected tools. The largest station-based programs did not become successful simply because they deployed more bikes. They built operational processes capable of supporting growth over many years.
The growth of systems like Vélib', Bicing, and BikeMi suggests that station-based bike sharing has found its place in modern cities long-term. The focus now is less on expansion alone and more on operating reliable, efficient networks that riders can depend on every da
Check out the full 2025 European Shared Mobility Index here: https://fluctuo.com/reports

🛴 🚲 At ATOM Connect 2026 in Riga, operators, technology providers, and industry experts came together to discuss where the market is heading and what will define successful operators in the coming years. The discussions covered everything from fleet economics and regulation to AI, insurance, MaaS, and operator growth stories.
Shared mobility continues to evolve quickly. At ATOM Connect 2026 in Riga, operators, technology providers, and industry experts came together to discuss where the market is heading and what will define successful operators in the coming years. The discussions covered everything from fleet economics and regulation to AI, insurance, MaaS, and operator growth stories.
One thing became increasingly clear throughout the event: The industry is entering a different phase. Growth is still happening, but the rules for winning are changing.
For years, shared e-scooters dominated headlines and rapid expansion stories. Now the conversation is gradually shifting.
Research presented by Frost & Sullivan suggests that e-bikes are increasingly becoming the preferred shared micromobility mode in many markets because of stronger unit economics, lighter regulatory friction, and changing rider behavior.
Some numbers presented:
Despite higher vehicle costs, e-bikes generate stronger long-term economics. We also saw examples from operators:
The interesting part is that e-bikes are gradually shifting from “fun transportation” toward everyday commuting infrastructure.
One surprising trend discussed during the event was that the European shared micromobility market continues growing despite relatively stable fleet sizes.
Normally, growth comes from deploying more vehicles. Now something different appears to be happening:
This is an important shift because it suggests the market is becoming more efficient. Instead of flooding cities with additional vehicles, operators are increasingly focused on generating more value from existing fleets.
Historically, shared mobility relied heavily on per-ride revenue. That model is also changing.
Frost & Sullivan highlighted subscriptions as one of the strongest trends for 2026, with subscription-heavy models showing positive profitability dynamics. This aligns with what many operators shared during discussions. Subscriptions bring several advantages:
The industry may gradually move toward a model that looks more like SaaS and memberships rather than only pay-per-use transportation.

AI was one of the strongest themes throughout the event. Only a few years ago, AI in mobility often meant pilots and interesting demos. Now operators increasingly use it for daily operations. Examples discussed included:
Frost & Sullivan identified AI-powered demand anticipation as one of the highest-impact trends for operators in 2026.
Yuri Narozniak from datafolio also shared examples where AI predicts high-risk insurance zones and dynamically adjusts risk models based on ride behavior. Datafolio additionally introduced integrated rider insurance options, with approximately 25% long-term rider adoption.
Regulation has become one of the biggest variables affecting operator success. Different cities continue taking very different approaches. Examples discussed included:
Positive developments:
Restrictions:
− Prague banning shared scooters
− Italy tightening compliance requirements
Cities want fewer operators, stronger compliance, and more accountability.
Winning a market increasingly depends on safety records, operational quality, data transparency, compliance history rather than simply deploying larger fleets.
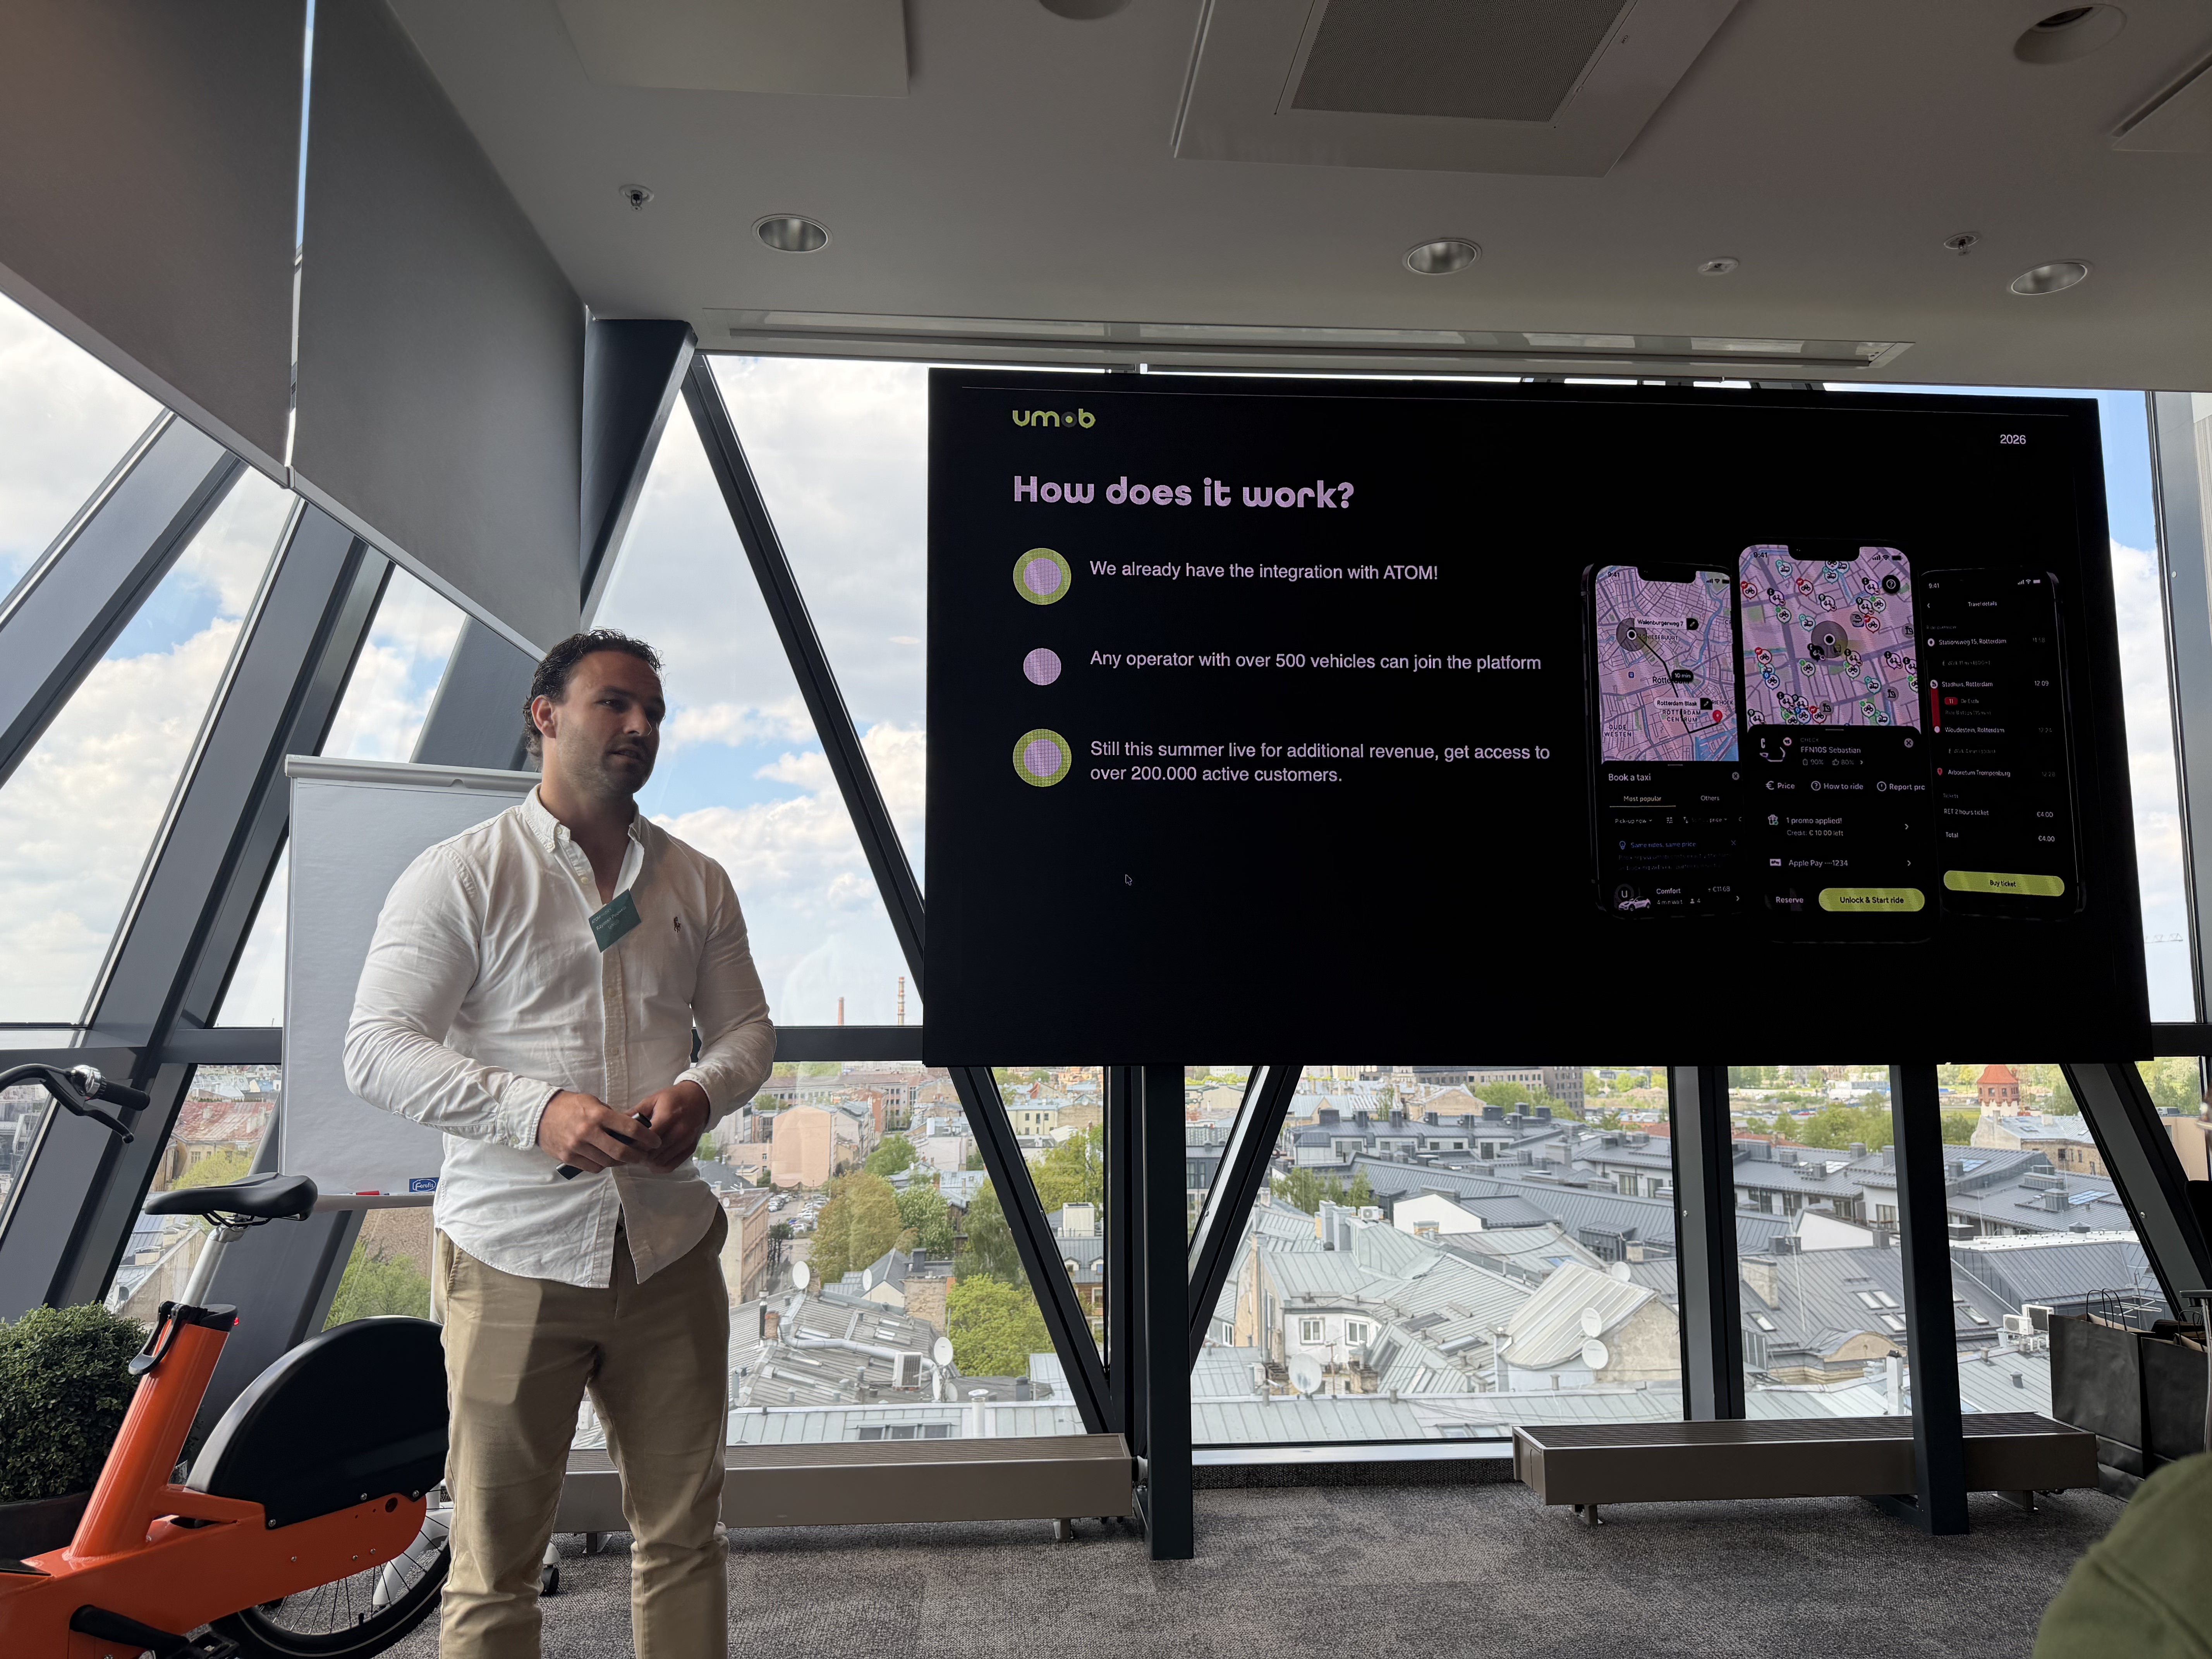
Raymon Pouwels shared the growth story behind umob and the continued expansion of Mobility-as-a-Service. The long-term vision remains simple: One interface, multiple transportation services.
Users increasingly expect transportation to behave similarly to digital services: Open one app -> See all options -> Choose what works best.
The market continues moving toward stronger integration between operators and MaaS platforms.
One slide from Frost & Sullivan summarized it particularly well:
"The operators still standing in 2026 didn't win on product - they won on discipline, selectivity, and city relationships."
Looking across both research and operator stories, common patterns repeatedly appeared:
✔ Lean and efficient operations
✔ Strategic market selection
✔ Diversified revenue streams
✔ Strong partnerships
✔ Data-driven decisions
✔ Safety and compliance focus
Thank you again to all speakers, partners, and participants who joined us at ATOM Connect 2026 and contributed to the discussions. We are excited to continue building the future of mobility together.
Want to continue the conversation? 🚀
Our team will be attending Micromobility Europe (June 2-3, Berlin) and we'll have a booth there. If you're attending too, come say hello, grab a coffee, and let's talk mobility ☕

"State of art technology in mobile apps and dashboard, very good SLA!"
"Easy, nice looking, continuously updated and developed every month and most of all very reliable with a extreme high uptime"
"We used to work with a different service provider which wasn't fitting our needs. Switching to ATOM was an improvement on our side"
Use test credentials to log in - Phone number: +1 123123123, Code: 777777


Driver App demo credentials - Email: test@atom.com, Password: driver